The Dragonfly Doji is a powerful candlestick pattern signaling a potential bullish reversal in financial markets. It forms when open, high, and close prices are nearly identical, with a long lower shadow indicating strong buying interest. This pattern suggests that despite initial selling pressure, strong buying interest pushed prices back up, indicating a shift in market sentiment. This guide will teach you how to identify this pattern, understand its market implications, and apply robust trading strategies with proper risk management.
While understanding Dragonfly Doji Candlestick Pattern is important, applying that knowledge is where the real growth happens. Create Your Free Forex Trading Account to practice with a free demo account and put your strategy to the test.
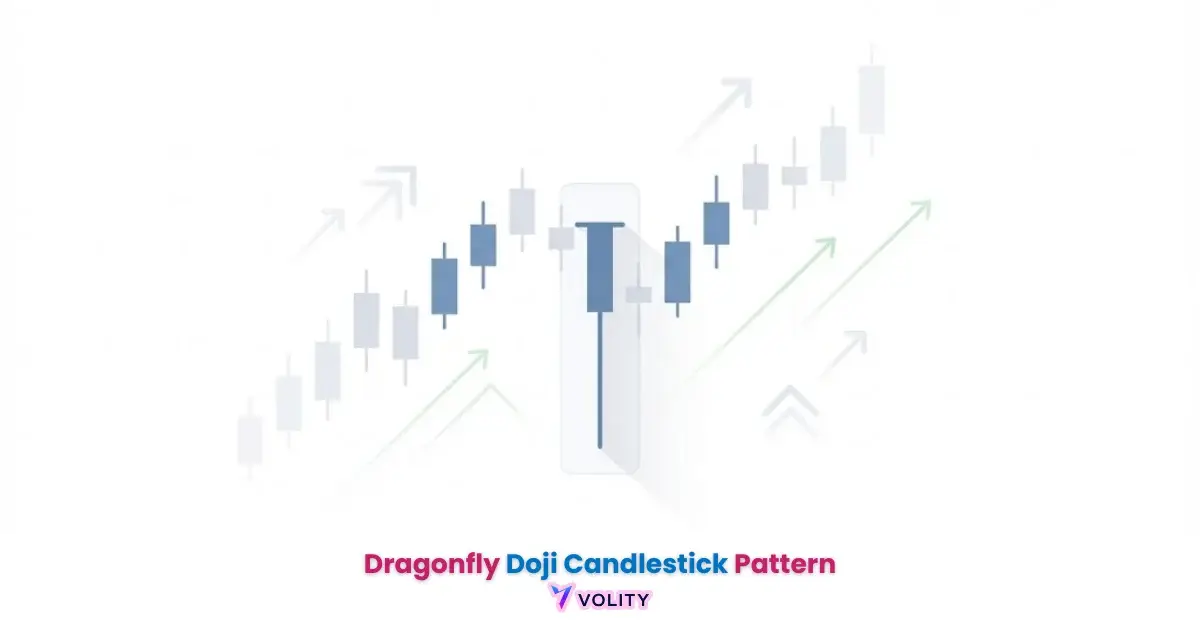
What is the Dragonfly Doji Candlestick Pattern?
The Dragonfly Doji is a type of Doji candlestick that predominantly signals a potential bullish reversal, typically appearing at the bottom of a downtrend. This pattern forms when the opening, highest, and closing prices are all at or very near the same level.
Its distinctive feature is a long lower shadow, while the upper shadow is either very short or non-existent. This visual characteristic provides crucial insights into the underlying price action and the battle between buyers and sellers. Understanding its formation helps traders identify potential shifts in market direction.
Open, High, Low, Close
To identify a Dragonfly Doji on a chart, observe its distinct structure. The pattern forms with the open, high, and close prices converging at or near the top of the candle’s range. The most prominent feature is its long lower shadow, which extends significantly downwards from the body.
This long lower shadow indicates that sellers initially pushed prices down, but buyers aggressively stepped in to push prices back up to the opening level.
The absence of an upper shadow, or a very short one, further emphasizes the strong rejection of lower prices and the buyers’ control by the close of the trading period.
Dragonfly Doji: Bullish Reversal & Market Sentiment
The Dragonfly Doji provides a powerful visual cue regarding market sentiment and potential trend reversal. It primarily indicates a bullish reversal when observed at the end of a downtrend.
The pattern suggests that selling pressure, which drove prices lower during the period, was decisively rejected by strong buying pressure, pushing the price back to its opening level. This shift signifies that buyers have absorbed the selling interest and are ready to take control, potentially initiating an upward price movement.
Buyer Strength Overpowering Sellers
A Dragonfly Doji indicates a strong rejection of lower prices, signaling that buyers have taken control from sellers. The long lower shadow demonstrates that despite initial bearish momentum pushing prices down significantly, strong buying interest emerged to push the price back to the opening and closing levels.
This often occurs at the end of a downtrend, suggesting a potential bullish reversal is imminent.
Improved Reversal Probability
The significance of a Dragonfly Doji increases considerably when it forms at established support levels. A support level is a price point where buying interest is strong enough to prevent the price from falling further.
When a Dragonfly Doji appears at such a level, it provides additional confirmation that buyers are stepping in aggressively to defend that price point. This confluence of the pattern with a key technical level enhances the probability of a successful trend reversal, making the signal more reliable for traders.
Avoiding False Signals
A Dragonfly Doji is not always bullish, and traders must avoid false signals by considering the market context. While typically a bullish reversal pattern, its interpretation changes if it appears at the top of an uptrend or in a sideways market.
In these scenarios, it can indicate indecision or a potential bearish reversal (though less common) rather than a strong bullish one. A Dragonfly Doji at a resistance level, for instance, should be treated with extreme caution, as it might signify that buyers are losing momentum rather than gaining it.
Ready to Elevate Your Trading?
You have the information. Now, get the platform. Join thousands of successful traders who use Volity for its powerful tools, fast execution, and dedicated support.
Create Your Account in Under 3 MinutesHow to Trade the Dragonfly Doji
Trading with a Dragonfly Doji pattern requires a well-defined trading strategy that incorporates confirmation and robust risk management. Many traders experience frustration when a Dragonfly Doji appears but the price does not reverse, often due to a lack of confirmation. This section outlines how to approach entries, exits, and protective measures to increase the reliability of this pattern within your trading plan.
Entry, Exit & Targets
To trade with a Dragonfly Doji pattern, establish a clear trading strategy focusing on entry, exit, and profit targets. A common entry point is typically above the high of the Dragonfly Doji itself or the high of the subsequent bullish confirmation candle. This ensures that the reversal is indeed taking hold.
Profit targets can be set at the next significant resistance level or using a predetermined risk-reward ratio. Always wait for further bullish price action after the Doji before entering a trade, rather than acting on the pattern alone.
Combining Dragonfly Doji with Other Indicators
Confirmation from subsequent candlesticks or other indicators is crucial, as the Dragonfly Doji alone can be unreliable. To improve the accuracy of a Dragonfly Doji signal, combine it with other technical analysis tools. Look for a subsequent bullish candle that closes above the Doji’s high.
Volume is another powerful confirmation tool; a significant increase in buying volume on the reversal candle adds strength to the signal. Simple combinations with indicators like moving averages (e.g., price bouncing off a key moving average) or the Relative Strength Index (RSI) showing oversold conditions can provide added conviction without overwhelming beginners.
Essential Stop Loss Placement
Effective risk management, including proper stop-loss placement, is paramount when trading any candlestick pattern. When trading a Dragonfly Doji, the stop loss should typically be placed just below the lowest point of the long lower shadow of the Doji. This placement defines your maximum risk for the trade. If the price falls below this level, it invalidates the bullish reversal signal, indicating that sellers are still in control. Adhering to strict stop-loss orders is critical to protect your capital from unexpected market movements.
A Critical Comparison
Mastering technical analysis involves distinguishing between similar patterns. The Dragonfly Doji and Gravestone Doji are often confused due to their similar structure but opposite implications. Understanding their differences is crucial for accurate market interpretation.
While both are types of Doji candlesticks characterized by open, high, and close prices being near identical, their shadows and market locations provide contrasting signals.
| Feature | Dragonfly Doji | Gravestone Doji | Hammer Candlestick |
| Appearance | Long lower shadow | Long upper shadow | Long lower shadow |
| Body | At top of candle | At bottom of candle | At top of candle |
| Location | Bottom of downtrend | Top of uptrend | Bottom of downtrend |
| Implication | Bullish reversal | Bearish reversal | Bullish reversal |
| Market Signal | Buyers reject lows | Sellers reject highs | Buyers reject lows |
Limitations & Improving Dragonfly Doji Accuracy
Like all tools in technical analysis, the Dragonfly Doji has inherent limitations. Relying solely on this single candlestick pattern can lead to inaccurate trades if not used with proper context and additional confirmation. Understanding these limitations is the first step toward improving its effectiveness in your trading strategy.
Inherent Limitations of Single Candlestick Patterns
The Dragonfly Doji pattern has inherent limitations, primarily its susceptibility to false signals and lack of contextual information.
Relying solely on single candlestick patterns like the Dragonfly Doji without additional context or indicators can lead to a high percentage of false signals, especially in volatile markets.
This pattern provides a snapshot of price action for a single period but does not inherently account for broader market trends, news events, or the overall strength of buying or selling pressure. Consequently, no single pattern is 100% accurate, and traders must be aware of its probabilistic nature.
The Role of Multiple Timeframes and Volume
To improve the accuracy of the Dragonfly Doji pattern, integrate it with multiple timeframe analysis and volume confirmation. Analyzing the pattern on a higher timeframe (e.g., daily chart) can confirm the overall trend and potential reversal, while a lower timeframe (e.g., hourly chart) can pinpoint a precise entry point.
Always seek volume confirmation; a noticeable surge in buying volume accompanying the Doji or the subsequent bullish candle adds significant credibility to the reversal signal. This multi-faceted approach reduces the likelihood of false signals and enhances the pattern’s reliability.
Turn Knowledge into Profit
You've done the reading, now it's time to act. The best way to learn is by doing. Open a free, no-risk demo account and practice your strategy with virtual funds today.
Open a Free Demo AccountPsychological Biases & Backtesting for Dragonfly Doji Mastery
Mastering the Dragonfly Doji requires not only technical understanding but also robust psychological discipline and empirical validation through backtesting. Most guides focus purely on pattern recognition and basic strategy, neglecting the behavioral and empirical aspects crucial for long-term success. Traders often ask, “I keep seeing Dragonfly Dojis, but the price doesn’t reverse.
Am I doing something wrong?” This frustration often stems from ignoring the role of psychological biases and the absence of data-driven validation. Relying solely on single candlestick patterns can lead to a high percentage of false signals, especially in volatile markets.
Understanding these pitfalls and leveraging tools like backtesting software can significantly improve a trader’s success rate. Unlike most guides, we delve into the psychological traps traders face when interpreting patterns like the Dragonfly Doji, offering strategies to overcome them and providing a solution for empirical validation.
The Bottom Line
The Dragonfly Doji is a powerful candlestick pattern predominantly signaling a bullish reversal at the end of a downtrend. Its distinctive long lower shadow reflects a strong rejection of lower prices by buyers. However, its accuracy significantly improves with confirmation from subsequent price action, volume, and other technical analysis indicators. Traders must be aware of its limitations, especially the potential for false signals, and avoid relying on it in isolation. Integrating robust risk management, understanding psychological biases, and employing backtesting software are crucial steps towards mastering this pattern for consistent trading success.
Key Takeaways
- The Dragonfly Doji is a bullish reversal pattern characterized by open, high, and close prices being nearly identical, with a long lower shadow.
- Its reliability increases significantly when found at established support levels and confirmed by rising volume or subsequent bullish candles.
- Always use a stop loss placed just below the Doji’s lowest point and avoid trading the pattern in isolation or at resistance levels.
- Enhance accuracy by combining the Dragonfly Doji with multiple timeframe analysis and complementary indicators like the Relative Strength Index (RSI).
- Mastering the Dragonfly Doji requires understanding psychological biases and validating strategies through backtesting for consistent trading success.