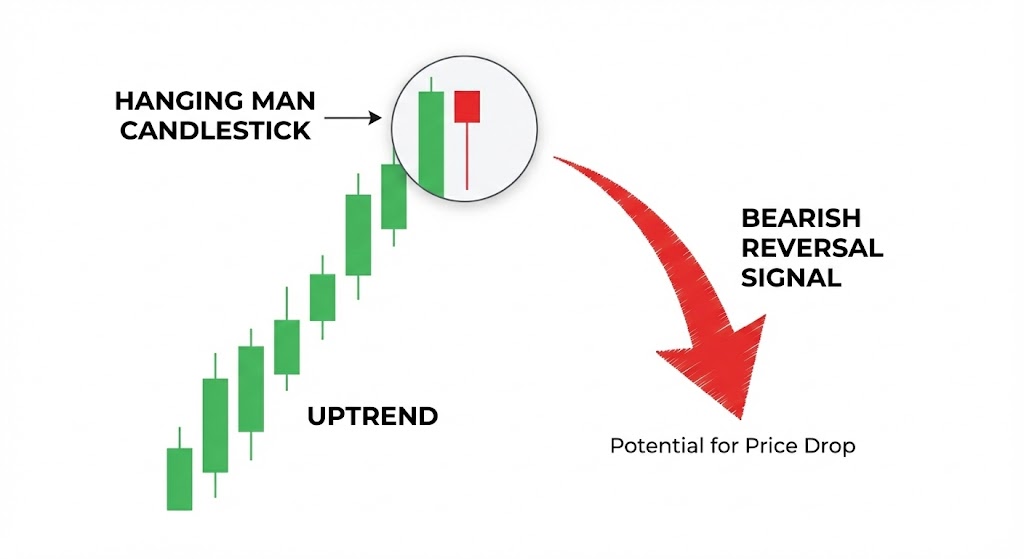
The Hanging Man candlestick is a bearish reversal pattern that forms at the peak of an uptrend. Characterized by a small real body and a long lower shadow (at least twice the body’s length), it visually represents a specific market failure: buyers pushed the price up, but sellers successfully forced it down during the session, signaling that the bulls are losing control.
Unlike standard market pauses, the Hanging Man indicates a fundamental shift in momentum. It serves as an early warning system, alerting traders that the prevailing uptrend has exhausted itself and a downturn is likely.
Mastering this pattern allows you to lock in profits or prepare for short positions before the reversal fully materializes.
While understanding Hanging Man Candlestick is important, applying that knowledge is where the real growth happens. Create Your Free Forex Trading Account to practice with a free demo account and put your strategy to the test.
What is the Hanging Man Candlestick and What Does it Signal?
The Hanging Man candlestick is a bearish reversal pattern that appears at the top of an uptrend, signaling a potential shift in market sentiment. It is characterized by a small real body, a long lower shadow at least twice the length of the real body, and little to no upper shadow. This formation suggests that selling pressure is beginning to outweigh buying interest, indicating that the uptrend may be losing momentum.
What is a Hanging Man candlestick?
The Hanging Man candlestick is a single-candle formation indicating a potential bearish reversal after a sustained prior uptrend. Its distinctive shape, resembling a hanging figure, alerts traders to a possible shift in market control from buyers to sellers. This pattern is a crucial part of technical analysis, helping to predict market turning points.
How do you identify a Hanging Man candle?
Identifying a Hanging Man candle requires observing several key characteristics. First, it must occur during an established prior uptrend, signaling potential exhaustion among buyers.
The candle itself possesses a small real body, which can be either bullish (green) or bearish (red), indicating that the opening and closing prices were relatively close. Crucially, it features a long lower shadow that is at least twice the length of the real body.
This long shadow implies that sellers aggressively pushed prices down during the trading period, but buyers managed to recover some ground by the close. There should also be little to no upper shadow, reinforcing the idea of strong selling pressure from the top.
What does a Hanging Man pattern indicate?
The Hanging Man pattern indicates that while buyers initially pushed prices higher, sellers emerged aggressively during the session, driving prices down significantly before buyers managed a slight recovery.
This intense selling pressure, represented by the long lower shadow, suggests that the bullish momentum is weakening and a potential shift in power is underway.
It signals a potential bearish reversal, where the market may soon turn downwards as selling interest overtakes buying enthusiasm. The Hanging Man pattern has a historical success rate of approximately 45-55% for predicting bearish reversals when confirmed by other indicators, as noted by Thomas Bulkowski in his Encyclopedia of Candlestick Charts. This emphasizes the need for additional confirmation rather than relying on the pattern in isolation.
Is the Hanging Man bullish or bearish?
The Hanging Man is definitively a bearish reversal pattern. It appears after an advance in price, signaling that the uptrend may be exhausted. While the real body can be either color, its placement at the top of an uptrend with a prominent lower shadow strongly suggests that bears are gaining control. This makes it a critical indicator for anticipating a downward price movement.
Ready to Elevate Your Trading?
You have the information. Now, get the platform. Join thousands of successful traders who use Volity for its powerful tools, fast execution, and dedicated support.
Create Your Account in Under 3 MinutesWhat is the difference between a Hanging Man and a Hammer?
Many traders often confuse the Hanging Man with the Hammer candlestick, despite their distinct market implications. The primary difference lies in the preceding trend where each pattern appears, which dictates their respective bullish or bearish signals.
Both patterns share a similar physical structure, but their context in the market is fundamentally opposite, making accurate identification crucial.
Structural Similarities and Key Differences
Both the Hanging Man and Hammer candlestick patterns share compelling visual similarities, featuring a small real body and a long lower shadow. This common structure can easily lead to confusion for new traders, as their physical appearance is nearly identical.
However, their interpretation diverges critically based on where they form within the market trend. The key difference is the trend immediately preceding the candle’s formation, which definitively dictates its signal and market implication.
Understanding this contextual distinction is paramount for accurate pattern recognition and trading decisions.
Market Context: Uptrend vs. Downtrend
The definitive factor distinguishing the Hanging Man from the Hammer candlestick is the crucial market context. A Hanging Man strictly forms at the peak of a prior uptrend, signaling a potential bearish reversal as buying momentum fades. Conversely, the Hammer candlestick appears at the bottom of a prior downtrend, indicating a potential bullish reversal as selling pressure exhausts. This contextual difference is paramount for accurate signal interpretation and avoiding common trading mistakes. Other candlestick patterns, such as the Engulfing Pattern, have different structures and reversal implications, further emphasizing the importance of precise pattern identification within its market environment.
| Criteria | Hanging Man | Hammer Candlestick |
| Preceding Trend | Established Uptrend | Established Downtrend |
| Signal | Potential Bearish Reversal | Potential Bullish Reversal |
| Implication | Selling pressure gaining, trend weakening | Buying pressure gaining, trend strengthening |
| Real Body | Small (can be bullish or bearish) | Small (can be bullish or bearish) |
| Lower Shadow | Long (at least 2x real body) | Long (at least 2x real body) |
| Upper Shadow | Little to None | Little to None |
How do you trade the Hanging Man pattern?
Trading the Hanging Man pattern effectively requires a disciplined approach, combining its signal with other technical analysis tools for confirmation and proper risk management. Successful execution involves identifying an optimal entry point, setting a strategic stop loss, and understanding the broader market context. This makes sure that potential bearish reversal signals are acted upon with a higher probability of success.
What other indicators confirm a Hanging Man pattern?
Confirming a Hanging Man pattern with additional indicators significantly increases its reliability as a bearish reversal signal. Key confirmation tools include Support and Resistance levels, Volume, Moving Averages, and the Relative Strength Index (RSI).
A Hanging Man forming near a strong resistance level or accompanied by increased selling volume strengthens the signal. Divergence in RSI or a break below a Moving Average can further validate the impending trend reversal.
When should you enter a trade after a Hanging Man?
A suitable entry point after a Hanging Man pattern typically occurs on the candle immediately following the Hanging Man, once it closes lower than the Hanging Man’s real body. This subsequent bearish candle acts as crucial confirmation that sellers have taken control. Traders often wait for a clear break below the low of the Hanging Man candle or a move below a key Support and Resistance level to initiate a short position. This patient approach helps avoid false signals.
What is a good stop loss for a Hanging Man trade?
A good stop loss for a Hanging Man trade is usually placed just above the high of the Hanging Man candle’s real body or, more conservatively, above its upper shadow if one exists.
This placement limits potential losses if the market unexpectedly reverses upwards, invalidating the bearish reversal signal. Implementing a strict stop-loss order reduces potential losses by an average of 30% per trade compared to no stop-loss, according to general industry data.
How to combine Hanging Man with other strategies?
Combining the Hanging Man with broader technical analysis strategies involves using it as a high-probability trigger within a larger market outlook.
For instance, if a market is in an overall downtrend on a higher timeframe, a Hanging Man on a lower timeframe near a resistance level could offer an excellent short entry. Traders can also integrate it with chart patterns, such as double tops, where the Hanging Man acts as the final confirmation of the reversal.
A real-world example might involve identifying a Hanging Man on a daily chart of EUR/USD after a multi-day rally. If this pattern forms at a significant resistance level and is confirmed by a subsequent bearish candle with increased volume, a trader could enter a short position.
The stop loss would be placed just above the Hanging Man’s high, and profit targets could be set at the next major support level. This comprehensive approach makes sure that the Hanging Man is not traded in isolation but as part of a well-defined strategy.
How reliable is the Hanging Man pattern?
The Hanging Man pattern, while a valuable signal, is not infallible and can sometimes lead to false signals or fail to predict a bearish reversal. Its reliability is influenced by various market factors, including overall market sentiment, volume, and the strength of the preceding trend. Understanding these limitations is crucial for traders to manage expectations and mitigate risks effectively.
Understanding False Signals
The Hanging Man can generate false signals if it appears in weak or choppy market conditions, or without sufficient volume to back the potential reversal.
Sometimes, the market might only experience a minor pullback before resuming its original uptrend, leading to frustration for traders expecting a full bearish reversal.
Factors such as news events or unexpected market catalysts can also override the pattern’s indication. Many traders feel the Hanging Man fails often, which often stems from ignoring these contextual elements.
Turn Knowledge into Profit
You've done the reading, now it's time to act. The best way to learn is by doing. Open a free, no-risk demo account and practice your strategy with virtual funds today.
Open a Free Demo AccountThe Importance of Confirmation
To minimize the limitations of the Hanging Man, confirmation from other technical analysis tools is paramount.
As discussed, waiting for a subsequent bearish candle, increased selling volume, or a break below Support and Resistance levels can significantly improve the pattern’s success rate.
Relying solely on the Hanging Man without additional validation is a common pitfall that can lead to losses. It is a warning signal, not a definitive trade entry.
Beyond the Charts: The Psychology of Trading Reversals
Beyond the technical identification of the Hanging Man pattern, successful trading of reversals fundamentally relies on understanding trader psychology.
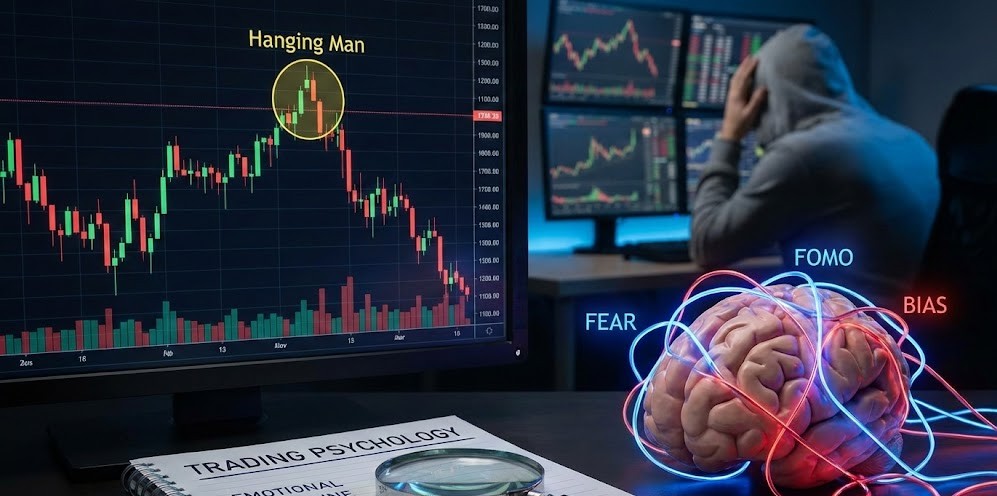
Emotional discipline and an awareness of cognitive biases are as crucial as pattern recognition for making profitable decisions.
Research in behavioral finance shows that psychological factors and emotional biases are among the leading causes of trading losses, particularly for less experienced traders.
One common pitfall is confirmation bias, where traders might prematurely interpret a potential Hanging Man as a definitive reversal, even without confirmation. This bias leads to ignoring contradictory signals and acting on incomplete information. Another challenge is the fear of missing out (FOMO), which can push traders to enter a trade too early or too late, driven by emotion rather than objective analysis.
To counteract these psychological traps, traders should cultivate a robust mental strategy. This involves strictly adhering to a predefined trading plan, including clear entry and stop loss rules, and avoiding impulsive decisions. Understanding market sentiment also becomes distorted by individual emotions.
By recognizing personal biases and maintaining emotional detachment, traders can interpret the Hanging Man signal more objectively, improving their overall trading performance. This holistic approach makes sure that technical insights translate into disciplined, effective trades.
Advanced Insights: Timeframe Analysis and Backtesting the Hanging Man
For traders looking to improve their Hanging Man strategy, analyzing timeframes and backtesting provides advanced insights often overlooked by other resources.
Understanding how the pattern performs across different timeframes is crucial, as its reliability can vary significantly.
For instance, a Hanging Man on a daily chart generally carries more weight than one on a 15-minute chart due to the larger sample size of price action.
Backtesting involves systematically applying a trading strategy to historical data to assess its viability before risking real capital. For the Hanging Man, this means identifying all occurrences of the pattern in past market data for a specific asset and timeframe.
Then, you would simulate trades based on your predefined entry, confirmation, and stop loss rules. This quantitative validation provides empirical evidence of the pattern’s historical success rate and potential profitability.
A robust backtesting process for the Hanging Man should involve testing it across various assets (e. g. , different currency pairs, stocks, commodities) and multiple timeframes.
This makes sure that the strategy is not curve-fitted to a single market condition. By analyzing the results, traders can gain confidence in their strategy, identify optimal timeframes, and understand the pattern’s true performance characteristics, moving beyond anecdotal observations. This data-driven approach is key to developing a resilient trading plan.
Key Takeaways
- Bearish Reversal Signal: The Hanging Man is a bearish reversal candlestick pattern that appears at the top of an uptrend, indicating potential selling pressure.
- Trend-Based Identification: Differentiate the Hanging Man from the Hammer by the prior trend—uptrend for Hanging Man, downtrend for Hammer.
- Confirmation Is Essential: Always validate the Hanging Man pattern using additional tools such as Volume, Support and Resistance levels, or RSI.
- Risk Management Matters: Proper stop loss placement and disciplined trader psychology are critical for executing successful Hanging Man trades.
- Data-Driven Validation: Backtesting and multi-timeframe analysis help improve the reliability and effectiveness of the pattern within a trading strategy.
BOTTOM LINE
The Hanging Man candlestick pattern serves as a powerful bearish reversal signal for traders, particularly when it appears at the end of a prior uptrend. Its distinct shape, characterized by a small real body and a long lower shadow, provides an early warning of shifting market dynamics.
However, successful application demands a nuanced approach, emphasizing confirmation from other technical analysis tools like Support and Resistance, Volume, and RSI. Crucially, integrating sound trader psychology, understanding cognitive biases, and rigorously backtesting the pattern across various timeframes are essential for transforming theoretical knowledge into consistent trading success.
This holistic understanding moves beyond basic pattern recognition, empowering traders to navigate complex market conditions with greater confidence and discipline.