Long candles are powerful visual cues on a candlestick chart, signaling strong market conviction and potential trend reversals. These extended bodies or wicks offer immediate insights into market sentiment and future price movements. This guide will teach you how to interpret long candle signals, apply them to entry and exit strategies, and manage risk effectively. By mastering their interpretation, you can make smarter, more confident trading decisions.
While understanding Long Candle is important, applying that knowledge is where the real growth happens. Create Your Free Forex Trading Account to practice with a free demo account and put your strategy to the test.
Long Candles in Trading: The Fundamentals
Long candles in trading are visual representations of price action over a specific period, signaling strong conviction. They help traders understand the underlying forces of buying and selling pressure.
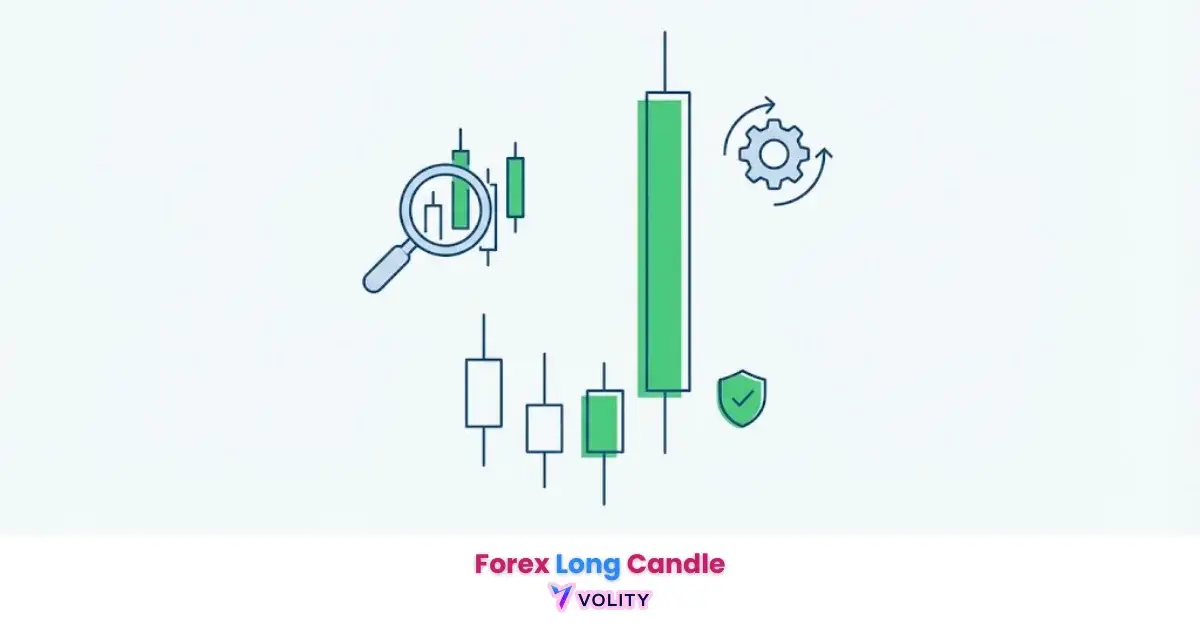
Body vs. Wick
A long candle is primarily characterized by a large body, which signifies strong buying or selling pressure, indicating a high conviction move in the market. The candlestick chart itself is composed of a body and wicks (or shadows).
A long body indicates that the price moved significantly from its open to its close. In contrast, a long wick (or shadow) indicates that the price reached extremes during the period but was ultimately rejected, closing far from its high or low.
Interpreting Market Sentiment from Long Bodies
Market sentiment is directly reflected in the length and color of a long candle’s body. A Long White Candle (or long green candle) indicates strong bullish sentiment, where buyers were in control, pushing the price significantly higher from its open to its close. This often signals sustained upward momentum.
Conversely, a Long Black Candle (or long red candle) signifies strong bearish sentiment, with sellers dominating and driving the price substantially lower from its open to its close, suggesting continued downward pressure.
Reversal Signals & Price Rejection
Long wick candles are crucial for identifying potential trend reversal points due to their inherent signal of price rejection. These candles highlight areas where the market attempted to push price in one direction but met strong opposition.
Price Rejection in Action
Long wicks (shadows) on a candlestick indicate significant price rejection at the high or low of the period, often preceding a potential trend reversal.
Also known as a long shadow candlestick, this pattern shows that while price reached an extreme point, it could not sustain that level and was pushed back by opposing forces. For example, a long upper wick means buyers tried to push the price higher but sellers stepped in aggressively, pushing it back down.
What is the significance of a long upper wick?
A long upper wick appearing after an uptrend often signals a bearish reversal. It indicates that buyers pushed the price to a new high, but sellers entered the market with enough force to drive the price significantly lower before the candle closed.
This suggests that the buying pressure is weakening, and selling pressure is increasing, potentially leading to a downward move. The longer the upper wick, the stronger the rejection of higher prices, and this is a powerful signal for an impending trend reversal.
What is the significance of a long lower wick?
A long lower wick, especially after a downtrend, typically signals a bullish reversal. This occurs when sellers initially push the price to a new low, but buyers step in decisively, pushing the price back up before the candle closes.
This demonstrates that the selling pressure is diminishing, and strong buying interest is emerging at lower price levels. The presence of a long lower wick often indicates that the market has found a bottom, and a potential upward trend reversal may be imminent.
Ready to Elevate Your Trading?
You have the information. Now, get the platform. Join thousands of successful traders who use Volity for its powerful tools, fast execution, and dedicated support.
Create Your Account in Under 3 MinutesHow to Use Long Candles for Entry & Exit?
Incorporating long candles into a trading strategy involves identifying key levels and seeking validation from additional market information.
How do you trade with long wick candles?
Trading with long wick candles involves identifying them at significant support and resistance levels. A long lower wick appearing at a support level, especially after a downtrend, suggests that buyers are defending that price floor, indicating a potential bullish reversal.
Traders might consider a long entry after the subsequent candle closes above the long wick’s body. Conversely, a long upper wick at a resistance level, particularly after an uptrend, signals sellers are defending that price ceiling, pointing to a potential bearish reversal.
A short entry could be considered after the next candle confirms the downward move.
What are the best strategies for trading long candles?
- The best strategies for trading long candles prioritize confirmation to avoid false signals.
- Successful trading with long candles often requires confirmation from other technical indicators or subsequent price action.
- For instance, a long lower wick signaling a potential bullish reversal becomes more reliable if accompanied by increasing volume.
- Traders also look for subsequent candles that confirm the direction indicated by the long candle.
- Related candlestick patterns that often involve long candles include the Doji, Hammer, Shooting Star, and Pin Bar. The Pin Bar, in particular, is a strong reversal pattern characterized by a very small body and a disproportionately long wick.
Long Candles Across Markets & Timeframes
The interpretation of long candles can vary significantly depending on the market conditions and the timeframe being analyzed.
How do long candles differ in bullish vs. bearish markets?
| Candlestick Type | Market Context | Interpretation | Actionable Insight |
| Long White Candle | Bullish Uptrend | Strong buying pressure | Trend continuation |
| Long White Candle | Bearish Downtrend | Potential bullish reversal | Look for confirmation of trend change |
| Long Black Candle | Bearish Downtrend | Strong selling pressure | Trend continuation |
| Long Black Candle | Bullish Uptrend | Potential bearish reversal | Look for confirmation of trend change |
| Long Upper Wick | Bullish Uptrend | Price rejection, sellers stepping in | Potential bearish reversal |
| Long Lower Wick | Bearish Downtrend | Price rejection, buyers stepping in | Potential bullish reversal |
What timeframe is best for identifying long candles?
The timeframe significantly impacts the reliability of long candle signals; higher timeframes (e.g., daily, weekly charts) are generally more reliable than lower timeframes (e.g., 5-minute charts) because they filter out much of the market “noise” and represent a broader consensus. Long candles are applicable across all markets (stocks, crypto, forex), but their significance is influenced by volatility and liquidity. In highly volatile markets like some cryptocurrencies, long candles might appear more frequently, potentially leading to more false signals without proper confirmation. Conversely, in illiquid markets, a single large order can create a long candle that doesn’t necessarily reflect broad market sentiment. Therefore, combining timeframe analysis with an understanding of volatility and liquidity is essential for identifying reliable long candle signals.
Advanced Confirmation & Risk Management
For professional traders, relying solely on long candles is insufficient. Advanced techniques for confirmation and robust risk management are critical for sustained profitability.
How do professional traders use long candles?
Professional traders combine long candles with other indicators for better confirmation. They often look for high volume accompanying a long candle signal. For instance, a long lower wick at a support and resistance level with significantly higher volume than average strengthens the bullish reversal signal, indicating strong institutional buying.
They also integrate other technical tools like the Relative Strength Index (RSI) or Moving Averages to confirm the momentum or trend direction indicated by the long candle.
Furthermore, some advanced traders use Order Flow analysis to gain deeper insights into the actual buying and selling orders behind the long candle formation, providing an edge in understanding market dynamics.
What are the risks of trading based solely on long candles?
Trading based solely on long candles carries inherent risks, primarily due to the possibility of false signals. Without proper confirmation, a long candle might appear to indicate a strong trend or reversal, only for the price to quickly move in the opposite direction. This can lead to unexpected losses and undermine a well-planned trading strategy.
To mitigate these risks, comprehensive risk management is essential. This includes careful position sizing, ensuring that no single trade risks more than a small percentage of total capital (e.g., 1-2%). Crucially, setting a stop loss order is vital.
For a long lower wick bullish reversal, a stop loss might be placed just below the wick’s low. For a long upper wick bearish reversal, it could be placed just above the wick’s high. This defines the maximum potential loss for each trade, protecting capital from adverse movements.
Turn Knowledge into Profit
You've done the reading, now it's time to act. The best way to learn is by doing. Open a free, no-risk demo account and practice your strategy with virtual funds today.
Open a Free Demo AccountCommon Trader Challenges & The Psychology of Long Candles
Many beginners struggle with the apparent contradictions of long candles, often misinterpreting their signals. Addressing these challenges requires understanding both technical and psychological factors.
Decoding Long Candle Reliability
Beginners often struggle with decoding long candle reliability because the visual drama of these candles can be misleading without proper confirmation. Users consistently ask, “I keep seeing huge candles, but they don’t always mean a strong trend. What am I missing?”
Often, what appears to be a strong directional move from a long candle can turn out to be a false breakout. In such scenarios, price initially pushes strongly in one direction, forming a long body or wick, but then quickly reverses, trapping traders who acted prematurely.
Understanding that a long candle is a signal, not a guarantee, and that it requires additional confirmation, is crucial for filtering out the noise and improving trading accuracy.
Fear, Greed, and Discipline
The Psychology of Trading plays a significant role in how traders react to long candles. Sudden, dramatic price movements that form long candles can trigger strong emotions like fear (of missing out on a big move) or greed (leading to over-leveraging). These emotional decisions are a significant factor in trading losses. For instance, a long bullish candle might induce FOMO, prompting a trader to enter late, just before a reversal. Conversely, a long bearish candle might cause panic selling at the bottom. Cultivating discipline is paramount.
Adhering to a predefined risk management plan, including strict rules for position sizing and stop loss placement, helps traders override emotional impulses and make rational decisions, even when faced with highly volatile price action indicated by long candles.
Tools & Resources for Identifying Long Candle Patterns
Modern trading environments offer various tools and resources to help traders efficiently identify and practice trading with long candle patterns.
What tools help identify long wick patterns?
Leveraging trading platforms and screeners is essential for identifying long wick patterns and other candlestick chart formations. Popular platforms like TradingView and MetaTrader offer advanced charting capabilities with built-in tools for drawing, analyzing, and even automatically identifying specific candlestick patterns.
Many platforms also feature market screeners that can filter thousands of assets based on custom criteria, including the presence of long candles or long wicks. For more advanced users, Algorithmic Trading systems can be programmed to automatically scan markets and alert traders to specific long candle formations, providing a significant advantage in speed and efficiency.
How can I practice trading long candles without risk?
To practice trading long candles without risk, demo accounts and backtesting are invaluable. Most brokers offer demo accounts that allow traders to execute trades with virtual money in real-time market conditions.
This provides a risk-free environment to apply trading strategy based on long candles, test different entry and exit points, and refine risk management techniques without financial exposure. Additionally, backtesting involves applying a trading strategy to historical data to see how it would have performed.
This helps build confidence in the strategy’s effectiveness and identify potential weaknesses before risking real capital. Both methods are crucial for developing the skills and discipline needed to trade long candles profitably.
Bottom Line
Understanding long candles is a foundational skill for technical traders, offering clear insights into market conviction and potential reversals. While powerful, their signals require confirmation from other indicators and a robust risk management strategy to avoid false signals. By combining technical interpretation with disciplined trading psychology, traders can effectively leverage long candles to refine their entry and exit points and navigate volatile market conditions with greater confidence.
Key Takeaways
- Long candles reveal strong market conviction, with long bodies indicating directional pressure and long wicks signaling price rejection and potential reversals.
- Confirmation from other technical indicators and an understanding of timeframe, volatility, and liquidity are essential to avoid false signals.
- Risk management, including strategic stop loss placement, is paramount when trading volatile moves indicated by long candles.
- Recognizing the psychology of trading—managing fear and greed—is critical for disciplined decision-making around dramatic long candle formations.