The Stick Sandwich pattern is a three-candle formation indicating a potential market reversal, typically appearing during a downtrend to signal a shift to bullish momentum. This pattern involves two outer candlesticks with the same opening and closing prices, sandwiching an opposite-colored middle candlestick. This guide covers its unique structure, how to trade it with precise entry/exit points, and essential risk management strategies to help you capitalize on trend reversals.
While understanding Stick Sandwich Candlestick Pattern is important, applying that knowledge is where the real growth happens. Create Your Free Forex Trading Account to practice with a free demo account and put your strategy to the test.
What is a stick sandwich candlestick pattern?
The Stick Sandwich pattern is a three-candle formation indicating a potential market reversal. It typically appears during a downtrend, signaling a possible shift to bullish momentum. This pattern involves two outer candlesticks with the same opening and closing prices, sandwiching an opposite-colored middle candlestick.
Historical Context and Significance
Candlestick patterns, originating from Japanese rice traders, offer visual insights into market psychology. The Stick Sandwich, like many other patterns, gained prominence in technical analysis by providing a structured way to interpret price action. Its significance lies in its ability to highlight moments where bearish momentum might be exhausting, setting the stage for a reversal.
Identifying the Stick Sandwich Pattern
Identifying the Stick Sandwich pattern involves recognizing its specific three-candle structure within the context of an existing trend. This pattern offers visual cues about the ongoing battle between buyers and sellers in the market. Its unique formation provides insights into potential shifts in market psychology.
How do you identify a stick sandwich pattern?
Identifying the Stick Sandwich pattern requires observing three consecutive candlesticks. The critical component of the pattern is the two outer candlesticks with the same opening and closing prices, sandwiching an opposite-colored middle candlestick.
The Three-Candle Structure: A Visual Breakdown
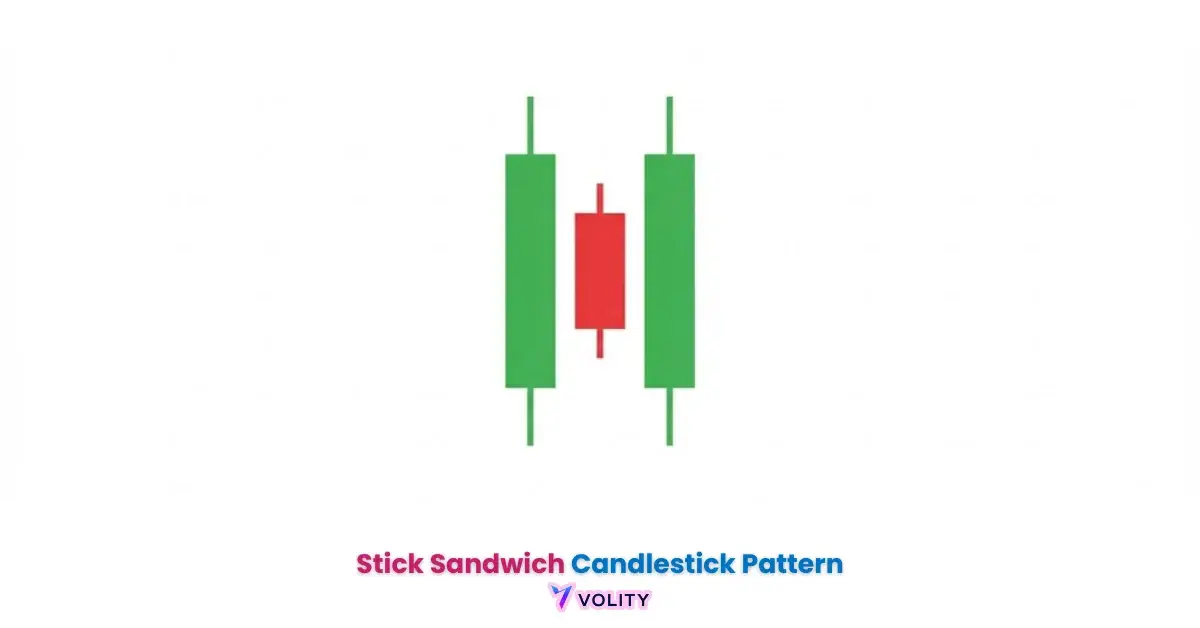
The Stick Sandwich pattern forms with a precise three-candle structure:
- First Candle: A long bearish (red) candlestick, continuing the prevailing downtrend.
- Second Candle: A bullish (green) candlestick, which gaps down or opens lower than the first, but closes higher within the body of the first candle.
- Third Candle: Another long bearish (red) candlestick, which opens at or near the closing price of the second candle and closes at the same level as the first candle.
This formation creates a visual “sandwich” with the bullish candle in the middle. The identical closing prices of the first and third candles are crucial for pattern validity.
What does a bullish stick sandwich mean?
A bullish Stick Sandwich means that sellers initially pushed prices lower, but buyers managed to reverse some of the losses, only for sellers to push prices back to the original low. This pattern appears in a downtrend and signals a potential shift to bullish momentum.
The market psychology suggests that despite bearish pressure, buyers are strong enough to prevent new lows, hinting at exhaustion among sellers.
What does a bearish stick sandwich mean?
A bearish Stick Sandwich means the opposite, appearing in an uptrend and signaling a potential shift to bearish momentum. Here, buyers initially pushed prices higher, but sellers managed to reverse some gains, only for buyers to push prices back to the original high.
Despite bullish pressure, sellers are strong enough to prevent new highs, suggesting buyer exhaustion and a possible reversal to the downside.
Ready to Elevate Your Trading?
You have the information. Now, get the platform. Join thousands of successful traders who use Volity for its powerful tools, fast execution, and dedicated support.
Create Your Account in Under 3 MinutesHow to Trade the Stick Sandwich Pattern
Trading the Stick Sandwich pattern effectively requires a clear strategy for entry, exit, and crucial confirmation signals. This involves understanding where to initiate a trade, set profit targets, and place stop-loss orders. Confirmation from other indicators significantly increases the pattern’s reliability.
To trade the Stick Sandwich pattern, traders typically wait for the third candle to close, confirming the pattern’s formation. Entry is usually placed just above the high of the third candle for a bullish reversal, or below the low for a bearish reversal.
Setting Up Your Trade: Entry and Exit Strategies
- After the Stick Sandwich pattern completes, a clear entry point is established.
- For a bullish setup, a common entry is a buy order placed slightly above the high of the third candle.
- This ensures that the market is indeed moving in the anticipated bullish direction.
- Profit targets are often set at significant resistance levels or previous swing highs where selling pressure might increase.
- Conversely, for a bearish setup, a sell order would be placed below the low of the third candle, with profit targets at support levels or previous swing lows.
What are the best indicators to confirm a stick sandwich?
- Confirmation is vital because no single pattern is 100% reliable on its own.
- Backtesting data suggests the bullish Stick Sandwich has a success rate of approximately 60-65% when confirmed by volume and trend analysis on daily charts.
Confirmation is Key: Volume & Technical Indicators
Confirmation is a critical step in validating the Stick Sandwich pattern. A significant increase in trading volume on the third candle, especially if it’s in the direction of the anticipated reversal, adds substantial credibility to the pattern. For a bullish Stick Sandwich, higher volume on the third bearish candle, followed by even higher volume on the subsequent bullish candle, indicates strong buying interest.
Additionally, technical indicators can provide further confirmation. For example, a bullish Stick Sandwich occurring when the RSI is in oversold territory (below 30) or when the MACD lines are crossing bullishly can strengthen the reversal signal. Conversely, a bearish Stick Sandwich in overbought conditions (RSI above 70) or with a bearish MACD crossover reinforces the bearish outlook. Always consider the overall trend and support and resistance levels when seeking confirmation.
Risk Management for Stick Sandwich Trades
Managing risk is paramount when trading the Stick Sandwich pattern or any other technical formation. No pattern guarantees success, and protecting capital from unexpected market movements is essential. Effective risk management strategies help mitigate potential losses and preserve trading capital.
What are the risks of trading the stick sandwich?
The risks of trading the Stick Sandwich pattern include false signals, pattern failure, and unexpected market volatility.
No candlestick pattern is 100% reliable, and emotional trading decisions often driven by fear or greed, account for up to 40% of retail trader losses, especially when patterns are not confirmed or risk management is neglected.
Why Risk Management is Non-Negotiable
Risk management is non-negotiable because the markets are inherently unpredictable. Even high-probability patterns like the Stick Sandwich can fail due to sudden news events, changes in market sentiment, or simply a lack of follow-through from market participants.
The psychological impact of losses, often leading to further emotional decisions, underscores the importance of a disciplined approach.
Protecting Against Pattern Failure
Setting a stop loss is a fundamental risk management technique that protects traders from significant losses if the pattern fails. For a bullish Stick Sandwich, a logical stop-loss placement would be just below the low of the middle bullish candle or below the low of the entire three-candle formation.
This ensures that if the price continues to fall against the anticipated reversal, the trade is automatically closed, limiting the downside. For a bearish pattern, the stop loss would be placed above the high of the middle bearish candle or the entire formation.
The Foundation of Risk Control
Position sizing is the foundation of risk control, directly answering the question of “How much should I risk per trade?” It involves determining the appropriate number of shares, contracts, or units to trade based on your total capital and risk tolerance. A common rule is the 1-2% rule, where a trader risks no more than 1% to 2% of their total trading capital on any single trade. For example, if you have a $10,000 account, you would risk a maximum of $100-$200 per trade.
This strategy ensures that a single losing trade does not severely impact your overall portfolio, allowing you to survive drawdowns and continue trading.
Stick Sandwich Pattern: Comparative Analysis
The Stick Sandwich is one of many candlestick patterns signaling reversals. Comparing it to other common patterns helps traders understand its unique characteristics and when to apply it most effectively.
| Pattern Name | Structure | Signal | Reliability (General) | Best Context | Key Differentiator |
| Stick Sandwich | 3 candles; 2 outer same color, same open/close; middle opposite color | Bullish/Bearish Reversal | Moderate | Downtrend/Uptrend | Outer candles “sandwich” middle one with matching open/close |
| Hammer/Hanging Man | 1 candle; small body, long lower/upper wick | Bullish/Bearish Reversal | Moderate | Downtrend/Uptrend | Long wick shows rejection of price, small body |
| Bullish/Bearish Engulfing | 2 candles; second candle completely engulfs first | Bullish/Bearish Reversal | High | Strong Downtrend/Uptrend | Large body of second candle covers previous candle |
| Morning/Evening Star | 3 candles; large 1st, small 2nd (gap), large 3rd | Bullish/Bearish Reversal | High | Strong Downtrend/Uptrend | Small middle candle gaps away, showing indecision |
| Piercing Line/Dark Cloud Cover | 2 candles; large bearish/bullish, followed by opposite covering >50% | Bullish/Bearish Reversal | Moderate | Strong Downtrend/Uptrend | Second candle penetrates deeply into the first |
Turn Knowledge into Profit
You've done the reading, now it's time to act. The best way to learn is by doing. Open a free, no-risk demo account and practice your strategy with virtual funds today.
Open a Free Demo AccountAdvanced Tips & Overlooked Insights
Optimizing your trading strategy with the Stick Sandwich pattern involves moving beyond basic identification to incorporate deeper insights. This includes understanding the psychological traps, assessing pattern reliability across various timeframes, and adapting to different market conditions.
Why do my stick sandwich trades often fail?
Stick Sandwich trades often fail due to a combination of factors, including emotional trading decisions, lack of confirmation, and unsuitable market conditions. Emotional trading decisions, often driven by fear or greed, account for up to 40% of retail trader losses, especially when patterns are not confirmed or risk management is neglected. Overcoming these psychological biases and adhering to a disciplined strategy is crucial.
The Psychology of Trading the Stick Sandwich: Avoiding Common Traps
The psychology of trading plays a crucial role in the success or failure of Stick Sandwich trades. Common traps include FOMO (Fear Of Missing Out), leading traders to enter prematurely before proper confirmation. Confirmation bias can also cause traders to only see signals that support their desired outcome, ignoring contradictory evidence.
Overconfidence after a few successful trades can lead to increased position sizing and neglecting stop losses. Maintaining discipline, sticking to a predefined trading plan, and understanding the emotional impact of wins and losses are vital for consistent execution.
Is the stick sandwich pattern reliable?
The Stick Sandwich pattern is reliable to a moderate degree, but its effectiveness significantly improves with proper confirmation and context. No pattern is 100% reliable on its own.
Backtesting data suggests the bullish Stick Sandwich has a success rate of approximately 60-65% when confirmed by volume and trend analysis on daily charts. Factors like timeframe, market volatility, and other technical indicators influence its reliability.
Understanding Pattern Reliability & Optimal Timeframes
The inherent reliability of the Stick Sandwich pattern is improved when used in conjunction with other analytical tools. While it offers a clear reversal signal, it’s not foolproof. The timeframe used for analysis significantly impacts reliability.
Higher timeframes, such as daily or weekly charts, generally offer more reliable signals than shorter timeframes like hourly or 15-minute charts. This is because longer timeframes filter out much of the market noise, making the patterns more significant. Analyzing historical performance data across different timeframes can help traders determine the optimal settings for their strategy.
Does the stick sandwich work in crypto?
Yes, the Stick Sandwich pattern can work in crypto, but its effectiveness varies due to the heightened volatility and unique market dynamics of cryptocurrencies. While the fundamental principles of technical analysis apply across asset classes, crypto markets are often characterized by rapid price swings and strong sentiment-driven movements.
This means that while the pattern may appear, its reliability might be lower without stringent confirmation from high trading volume and other indicators. Traders should backtest the pattern specifically on crypto assets and use tighter risk management protocols.
Bottom Line
The Stick Sandwich pattern is a valuable three-candle reversal signal that, when properly identified and confirmed, can offer significant trading opportunities. Its unique structure provides insights into market psychology, highlighting potential shifts from bearish to bullish momentum, or vice versa. By integrating this pattern with sound entry/exit strategies, robust risk management, and complementary technical indicators, traders can enhance their decision-making and improve their chances of success in dynamic markets.
Key Takeaways
- The Stick Sandwich pattern is a three-candle formation primarily signaling a bullish reversal, though a bearish variant exists.
- Identification relies on two outer candles having the same open and close, sandwiching an opposite-colored middle candle.
- Trading strategies require precise entry and exit points, confirmed by volume and technical indicators like RSI or MACD.
- Risk management, including stop loss placement and position sizing, is critical to protect capital against pattern failure.
- The pattern’s reliability varies by timeframe and market conditions, with higher timeframes generally offering more robust signals.