A triple candlestick pattern is a three-candle formation in technical analysis that signals a likely shift in market sentiment. These patterns offer stronger confirmation for trend reversals or continuations compared to single or double patterns. Traders use them to refine entries in a 3-candle forex strategy.
While understanding Triple Candlestick Patterns is important, applying that knowledge is where the real growth happens. Create Your Free Forex Trading Account to practice with a free demo account and put your strategy to the test.
Key Takeaways
- A triple candlestick pattern is a three-candle formation that offers a more reliable signal for market reversals or continuations than single or double patterns.
- The two main types are reversal patterns (like the Morning Star) that signal a potential trend change, and continuation patterns (like Three White Soldiers) that confirm a trend will likely resume.
- A pattern alone isn’t a trade signal. Confirmation is mandatory before entering any trade.
- To confirm a pattern, always validate it with the broader market context, key support/resistance levels, and supporting technical indicators like RSI and Volume.
- Always use a volatility-based tool like the Average True Range (ATR) to set a realistic stop-loss and avoid getting stopped out by normal market noise.
- The Morning Star is widely considered one of the best patterns for day trading because it provides a clear, early reversal signal on intraday charts.
What is a Triple Candlestick Pattern?
A triple candlestick pattern is a price formation composed of three consecutive candlesticks that, when analyzed together, signal a probable change in market direction or a confirmation of the existing trend.
The relationship between the bodies and wicks of these three candles tells a complete story about the struggle between buyers and sellers. While single candlestick patterns offer a snapshot and double candlestick patterns provide more context, triple candlestick patterns offer a more reliable signal of market momentum.
Triple Candlestick Chart Pattern Meaning
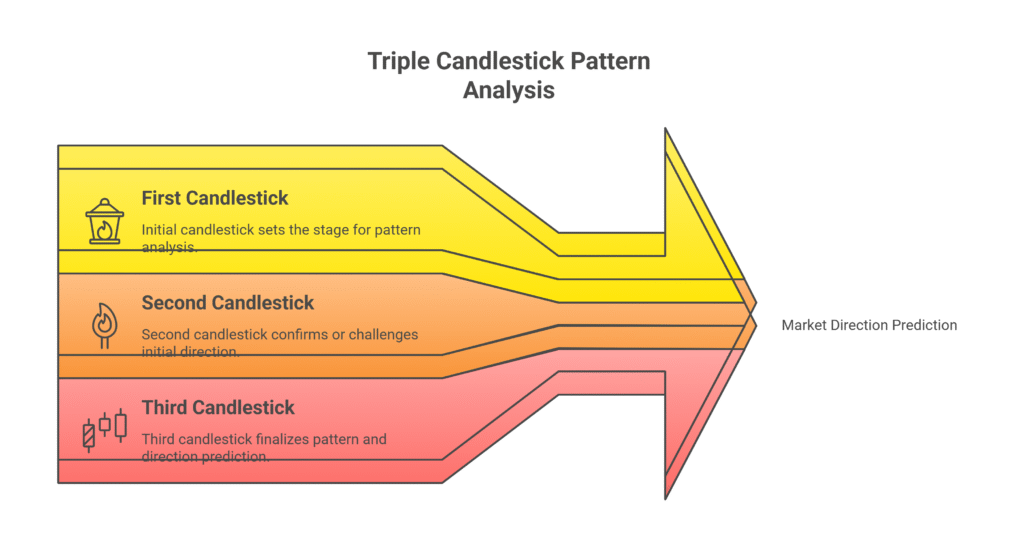
The meaning of a triple candlestick pattern is derived from the interaction of the three candles.
- The first candle typically represents the prevailing trend and momentum.
- The second candle often shows indecision, a slowdown, or a pause in the market.
- The third candle indicates the new direction as a different group (buyers or sellers) takes control.
A strong bullish third candle suggests a potential rise in price, while a strong bearish third candle suggests a potential drop.
Ready to Elevate Your Trading?
You have the information. Now, get the platform. Join thousands of successful traders who use Volity for its powerful tools, fast execution, and dedicated support.
Create Your Account in Under 3 MinutesKey Triple Candlestick Patterns: Reversal vs. Continuation
Triple candlestick patterns fall into two main categories: reversal and continuation. Reversal patterns suggest a trend is ending, while continuation patterns signal a trend is likely to resume after a brief pause.
| Pattern Name | Type | Key Characteristics |
| Morning Star | Bullish Reversal | Forms after a downtrend. It consists of a long bearish candle, a small-bodied candle (or doji), and a long bullish candle that closes above the midpoint of the first candle. |
| Evening Star | Bearish Reversal | Forms after an uptrend. It consists of a long bullish candle, a small-bodied candle, and a long bearish candle that closes below the midpoint of the first candle. |
| Three Inside Up | Bullish Reversal | Forms after a downtrend. It consists of a long bearish candle, a second bullish candle that closes inside the first candle’s body, and a third bullish candle that closes above the first candle’s high. |
| Three Inside Down | Bearish Reversal | Forms after an uptrend. It consists of a long bullish candle, a second bearish candle that closes inside the first candle’s body, and a third bearish candle that closes below the first candle’s low. |
| Tri-Star | Reversal (Bullish/Bearish) | A rare pattern made of three consecutive doji candles, with the second doji gapping away from the first, signaling extreme indecision before a sharp reversal. |
| Three White Soldiers | Bullish Continuation | Three consecutive long bullish candles, each closing higher than the last, confirming strong upward momentum. |
| Three Black Crows | Bearish Continuation | Three consecutive long bearish candles, each closing lower than the last, confirming strong downward pressure. |
What is the Triple Candle Confirmation?
The triple candle confirmation is a technical analysis method used to validate a potential market move by analyzing three consecutive candlesticks in conjunction with other market factors before entering a trade.
How to Trade Triple Candlestick Patterns in 5 Steps?
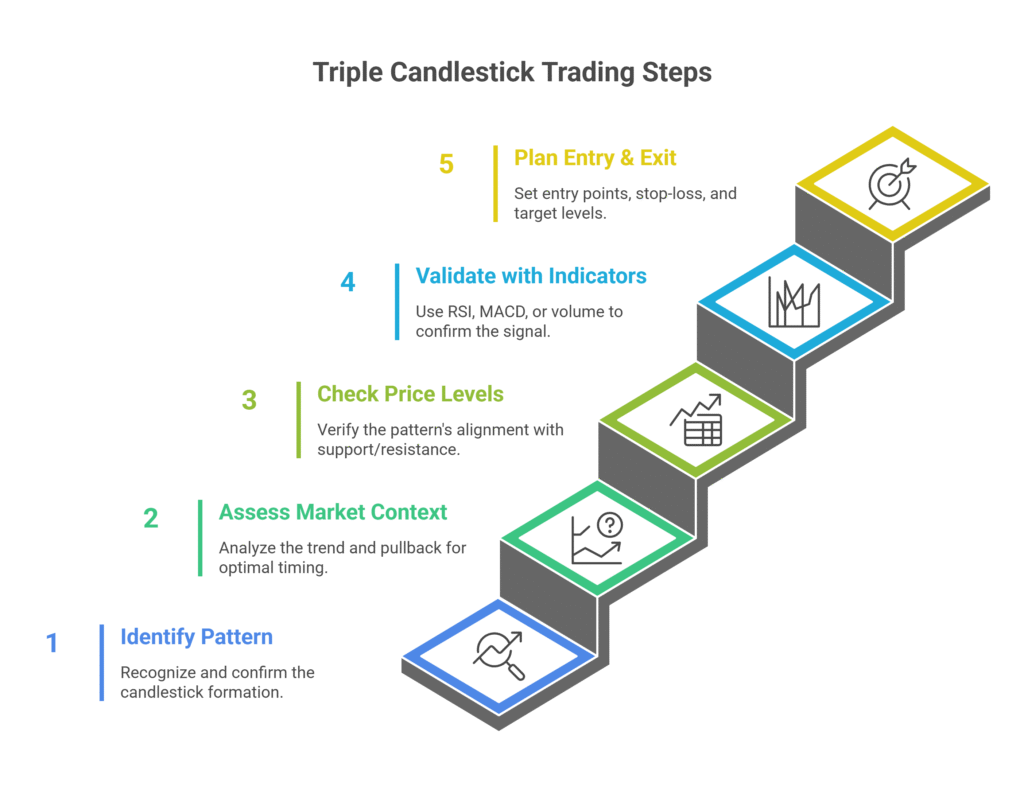
Follow this five-step process to identify, confirm, and execute triple candlestick trades with higher accuracy.
- Identify the Pattern – Spot a valid triple candlestick formation (e.g., Morning Star, Three White Soldiers) and confirm the size, shape, and position of all three candles match the pattern rules.
- Assess Market Context – For reversals, trade them at the end of a strong trend; for continuations, look for them mid-trend, ideally after a small pullback.
- Check Key Price Levels – Improve reliability by confirming the pattern forms near major support/resistance, trendlines, or important moving averages.
- Validate with Indicators – Use RSI, MACD, or volume for confirmation; for example, a bullish reversal with RSI rising from below 30 adds strength to the setup.
- Plan Entry & Exit – Enter after the third candle confirms direction, place a stop-loss beyond the pattern’s high (short) or low (long), and target the next major support/resistance with a minimum 1:2 risk/reward ratio.
Best Indicators to Combine With Triple Candlestick Patterns
Combining patterns with technical indicators increases the probability of a successful trade by confirming momentum, trend, and volatility.
| Indicator | Primary Function | Best Confirmation Signal |
| Moving Averages (MA & EMA) | Defines the overall trend direction. | A bullish pattern forming above key MAs (like the 50 & 200 EMA) confirms upward momentum. |
| Relative Strength Index (RSI) | Measures momentum and identifies overbought (>70) or oversold (<30) conditions. | A reversal pattern is much stronger when it appears in an overbought or oversold zone. |
| Volume Indicators | Confirms the market conviction behind a price move. | The third candle of a reversal pattern forming on rising volume shows strong participation. |
| MACD | Validates momentum shifts and potential trend reversals. | A MACD line crossover that moves in the same direction as the candlestick pattern’s signal. |
| Support & Resistance Levels | Identifies key price zones that act as high-probability turning points. | A reversal pattern is significantly more reliable when it forms directly at a major support or resistance level. |
| Average True Range (ATR) | Measures current market volatility. | It doesn’t confirm a pattern but helps set a realistic stop-loss outside of normal price noise. |
Real Trade Walkthrough with Triple Candlestick Pattern (Morning Star Example)
This walkthrough demonstrates a structured approach to trading the Morning Star, a bullish triple candlestick reversal pattern, to avoid common errors.
- Scenario: On a 4-hour chart, EUR/USD is testing a major support zone at 1.0800 after a long downtrend. A Morning Star pattern forms at this level.
- Step 1: Identify the Context. First, check the daily chart to confirm the significance of the 1.0800 support level. Seeing that this level has historically produced strong bounces confirms its importance.
- Step 2: Set a Confirmation Entry. Instead of entering immediately after the third candle closes, place a buy-stop order a few pips above the high of the third candle (e.g., at 1.0840). This action ensures upward momentum is confirmed before entering the trade.
- Step 3: Validate with Indicators. Check supporting indicators. An RSI rising from oversold territory (e.g., from 25 to 38) and an increase in volume on the third bullish candle validates the buying pressure suggested by the pattern.
- Step 4: Set a Volatility-Based Stop-Loss. Use the Average True Range (ATR) to set a logical stop-loss. If the ATR is 22 pips, placing the stop-loss 25 pips below the pattern’s low (at 1.0775) prevents the trade from being stopped out by normal market noise.
- Step 5: Manage the Trade Actively. Once the trade is in profit and moves halfway to the profit target, move the stop-loss to the breakeven point. This action protects your initial capital and secures a risk-free trade.
What is the Best Triple Candlestick Pattern for Day Trading?
The Morning Star pattern is widely considered the most effective triple candlestick pattern for day trading. Its structure clearly signals a potential bullish reversal after a downtrend and is highly effective on intraday timeframes like the 15-minute and 1-hour charts.
The pattern allows day traders to identify early shifts in momentum. When a Morning Star is confirmed with a volume increase, RSI recovery from oversold levels, or a break of intraday resistance, it provides high-probability trade setups.
Other strong patterns for day trading include:
- Evening Star for bearish reversals.
- Three White Soldiers for bullish continuations.
- Three Black Crows for bearish continuations.
The best choice depends on the market’s overall trend, session liquidity, and the trader’s directional bias.
Turn Knowledge into Profit
You've done the reading, now it's time to act. The best way to learn is by doing. Open a free, no-risk demo account and practice your strategy with virtual funds today.
Open a Free Demo AccountBottom Line
Triple candlestick patterns like the Morning Star and Three White Soldiers are powerful formations that reflect a clear shift in market sentiment.
- Context is Key: Always analyze patterns in the context of the broader market trend and key support/resistance levels.
- Confirmation is Mandatory: Use supporting indicators like RSI, MACD, and volume to validate the pattern’s signal before entering a trade.
- Manage Risk Systematically: Use volatility-based tools like the ATR to set logical stop-loss and take-profit levels.