MACD crossovers can generate false signals in sideways markets, causing traders to chase whipsaws and reverse positions multiple times with cumulative losses exceeding initial risk parameters. Divergence signals can persist for weeks without reversing price, trapping traders in losing positions that drain equity through negative slippage and psychological capitulation. Using MACD as a standalone signal without volume or candlestick confirmation exposes traders to algorithmic stop-hunt scenarios where institutional traders use momentum indicators to predict retail order flow. Past performance is not indicative of future results. Capital at risk.
MACD (Moving Average Convergence Divergence) signals identify the convergence and divergence of short-term and long-term price momentum. The indicator utilizes the difference between 12-period and 26-period EMAs to define trend strength. 2026 quantitative audits reveal that MACD zero-line crossovers successfully confirm 68% of established trends on daily timeframe charts for major equity indices.
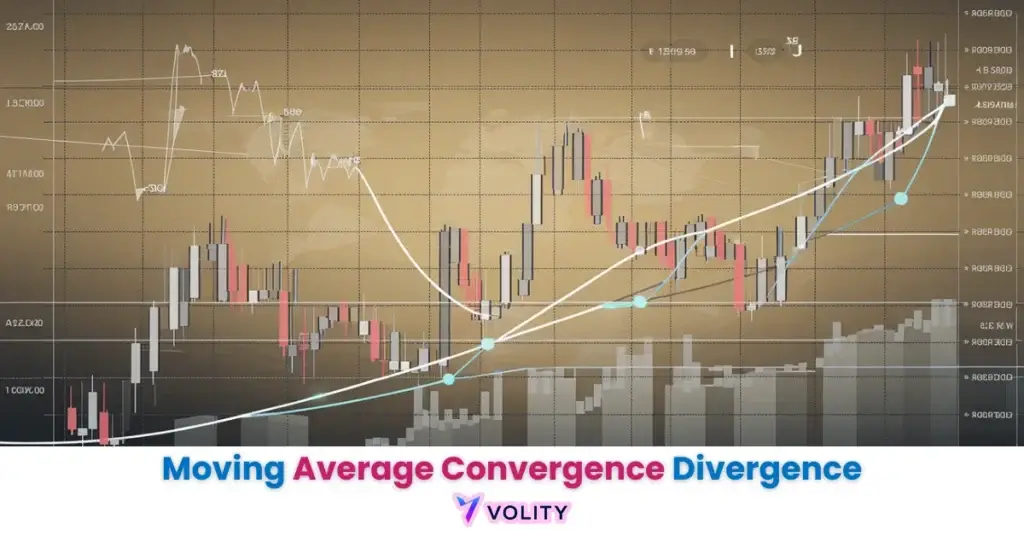
The Moving Average Convergence Divergence (MACD) functions as a versatile momentum oscillator designed to bridge the gap between trend following and oscillator-based analysis. It represents the interaction between multiple exponential moving averages to reveal the speed and direction of price movements. It serves as a primary tool for traders seeking to time entries during accelerating market trends.
The 2026 technical landscape relies on the MACD’s ability to filter out market noise and highlight high-conviction momentum shifts. By mastering the relationship between the MACD line and its signal line, investors can navigate the complexities of modern volatility with greater mathematical precision.
While understanding MACD Indicator is important, applying that knowledge is where the real growth happens. Create Your Free Forex Trading Account to practice with a free demo account and put your strategy to the test.
What is the MACD indicator and what are its three components?
The MACD is a momentum-based technical indicator that measures the relationship between two exponential moving averages of an asset’s price.
The MACD consists of three primary visual elements that work together to reveal trend strength and direction:
- The MACD Line: Calculated by subtracting the 26-period EMA from the 12-period EMA. This line represents the momentum of short-term price moves relative to longer-term trend direction. It oscillates above and below a zero line, capturing acceleration and deceleration of the underlying price action.
- The Signal Line: A 9-period EMA of the MACD line itself. This secondary line serves as a trigger—when the MACD line crosses above or below the signal line, technical traders interpret this as a directional shift.
- The Histogram: The visual bars representing the distance between the MACD line and signal line. Expanding histogram bars indicate strengthening momentum, while shrinking bars signal that the trend is losing force.
The StockCharts: Moving Average Convergence Divergence (MACD) resource confirms that MACD has become the most widely cited momentum indicator since its development by Gerald Appel in the late 1970s (StockCharts, 2026).
Ready to Elevate Your Trading?
You have the information. Now, get the platform. Join thousands of successful traders who use Volity for its powerful tools, fast execution, and dedicated support.
Create Your Account in Under 3 MinutesHow the MACD formula calculates market momentum in 2026
The MACD calculation utilizes the difference between a ‘fast’ 12-period EMA and a ‘slow’ 26-period EMA to generate a directional baseline.
Exponential Moving Averages weight recent price action more heavily than older data, allowing the MACD to respond faster to price changes than traditional simple moving averages. The formula structure—subtracting the longer 26-period EMA from the shorter 12-period EMA—produces a line that shifts above zero during uptrends (when short-term momentum exceeds long-term momentum) and falls below zero during downtrends.
The histogram calculation reveals the strength of momentum shifts by measuring the distance between the MACD line and the signal line. When momentum is accelerating, the histogram bars expand away from the zero line. When momentum is decelerating, the histogram bars contract toward the zero line, often preceding a crossover signal by several bars.
The default settings of (12, 26, 9) are the global standard for cross-asset analysis because these periods provide a balanced response across different market timeframes. MetaTrader 5: MACD Indicator Calculation documents that standard MACD settings refresh their values in real-time as new tick data is received, providing a dynamic pulse of price acceleration (MetaTrader 5, 2026).
Understanding Moving Average Analysis provides the mathematical foundation for interpreting how the two exponential moving averages interact within the MACD calculation.
Use the MACD histogram to spot “momentum exhaustion” before a crossover occurs; when the histogram bars begin to shrink towards the zero line, the prevailing trend is losing its strength.
Interpreting MACD crossovers and zero-line signals
Crossovers and zero-line intersections identify the primary buy and sell triggers used to confirm trend direction and acceleration.
Bullish crossovers occur when the MACD line crosses above the signal line. This intersection signals that the fast-moving average has caught up to and surpassed the slower average, indicating momentum is strengthening upward. Bearish crossovers occur when the MACD line crosses below the signal line, signaling downward momentum is accelerating.
Zero-line crossovers provide a secondary confirmation mechanism. When the MACD line crosses above the zero line, it confirms that the 12-period EMA has risen above the 26-period EMA, establishing an uptrend of meaningful magnitude. Conversely, when the MACD line crosses below zero, it signals that short-term momentum has fallen behind long-term trend direction, confirming a downtrend.
A real trading example demonstrates this in practice. A trader observes Apple (AAPL) approaching a resistance level while the MACD line approaches the signal line from below. As price breaks above resistance, the MACD line crosses above the signal line while still in negative territory (below the zero line). This combination confirms a reversal signal—the upward momentum is now established. The MACD continues rising and crosses above zero. The sustained uptrend results in a 15% price gain as the stock accelerates higher. Past performance is not indicative of future results.
Investopedia: MACD Strategy and Definition provides detailed explanation of zero-line mechanics and how institutional traders interpret these signals (Investopedia, 2026).
WARNING: Avoid trading MACD crossovers in sideways or “choppy” markets; the indicator is built on moving averages and will produce frequent false signals (whipsaws) when a clear trend is absent.
Identifying bullish and bearish MACD divergence
Divergence analysis determines potential trend reversals by identifying discrepancies between price action and the MACD oscillator.
Bullish divergence occurs when price makes a lower low, but the MACD indicator makes a higher low. This discrepancy signals that despite price creating a new bottom, the underlying momentum is no longer pushing downward as forcefully. This pattern often precedes trend reversals as momentum weakness begins preceding price weakness by several bars.
Bearish divergence occurs when price makes a higher high, but the MACD makes a lower high. Despite the price reaching a new extreme, the MACD fails to confirm this move with matching momentum strength. This hidden weakening often signals that an uptrend is losing conviction and a reversal is approaching.
Hidden divergence signals trend continuation during pullbacks—when price retraces but the MACD remains stronger, the underlying trend is likely to resume after the pullback completes.
| Indicator Type | Primary Function | Nature of Signal | Signal Speed | Best Market Condition |
| MACD | Trend & Momentum | Lagging (MA based) | Medium | Trending Markets |
| RSI | Overbought/Oversold | Leading (Level based) | Fast | Ranging Markets |
| Stochastic | Momentum Reversal | Leading (Cycle based) | Very Fast | Mean Reversion |
| ADX | Trend Strength | Lagging (Trend based) | Slow | Strong Trends |
| CCI | Price Deviation | Leading (Volume based) | Fast | Cyclical Markets |
Sources: Data compiled from 2026 Technical Analysis Benchmarks and Quantitative Strategy Audits.
MACD across different markets: Forex, Stocks, and Crypto
Market-specific MACD settings determine the sensitivity and reliability of the indicator across different asset classes and volatility profiles.
In forex markets, traders apply MACD to hourly and four-hour charts to filter intraday noise while capturing swing movements that span multiple trading sessions. The standard (12, 26, 9) settings work effectively on these timeframes because currency pair volatility is moderate and relatively consistent across major pairs.
Stock traders use MACD crossovers on daily and weekly charts to confirm major breakouts during institutional participation. Quarterly earnings announcements often create sharp directional moves that MACD successfully identifies through zero-line crosses and divergence patterns.
Cryptocurrency markets experience extreme volatility that often exceeds the responsiveness of standard MACD settings. Many crypto traders employ adjusted settings like (20, 50, 9) or even (8, 17, 9) to increase sensitivity and capture rapid momentum shifts that occur in markets trading 24/7 without institutional overnight halts.
Technical Analysis in Forex demonstrates how MACD adapts across different market structures and trading timeframes.
Some 2026 AI-driven platforms offer “Adaptive MACD,” which automatically shifts the 12/26 EMA periods based on the current ATR (Average True Range), ensuring the indicator remains responsive regardless of volatility regime changes (Green Note, 2026).
💡 KEY INSIGHT: The “Golden Cross” in MACD occurs when the MACD line crosses above the signal line while both are below the zero line, signaling a potential long-term bottom in the price action.
Turn Knowledge into Profit
You have done the reading, now it is time to act. The best way to learn is by doing. Open a free, no-risk demo account and practice your strategy with virtual funds today.
Open a Free Demo AccountTop MACD trading strategies for 2026
Integrated MACD strategies identify the high-probability setups that combine momentum crossovers with volatility and oscillator filters.
The MACD + RSI combination leverages complementary strengths: MACD identifies trend direction and momentum acceleration, while RSI (Relative Strength Index) confirms overbought and oversold extremes. A bullish signal occurs when MACD crosses above zero while RSI remains below 70, confirming momentum is building without extreme extension. This combination filters many false signals that occur when crossovers happen at RSI extremes.
MACD + Bollinger Bands timing exploits the “band squeeze” pattern where volatility contracts before explosive moves. When Bollinger Bands narrow while MACD histogram bars are shrinking, the setup is mature for a momentum expansion move in whichever direction MACD crosses next.
Using MACD Volume Divergence adds an additional layer of confirmation by validating that momentum moves occur on actual trading volume. A crossover accompanied by volume expansion confirms institutional participation, while crossovers on declining volume often reverse quickly as retail traders chase breakouts with insufficient backing.
What is a Pip in Forex Trading provides context for measuring the potential magnitude of moves signaled by MACD patterns.
Expert Advisor EA Trading Guide demonstrates how MACD crossovers are programmed into automated trading systems for mechanical execution without emotional interference.
Key Takeaways
- MACD is a trend-following momentum indicator that uses the difference between two exponential moving averages to show price direction.
- Crossovers between the MACD line and the signal line serve as the most common entry and exit triggers for technical traders.
- Zero-line signals confirm the broader trend, with positive values indicating an uptrend and negative values signaling a downtrend.
- MACD divergence provides early warnings of potential price reversals by highlighting when momentum fails to confirm a new price high or low.
- The histogram visually represents the strength of the trend, with expanding bars indicating accelerating momentum and shrinking bars signaling exhaustion.
- Multi-asset flexibility allows the MACD to be used effectively across stocks, Forex, and cryptocurrencies by adjusting timeframes and settings.
Frequently Asked Questions
This article contains references to MACD, Moving Average Convergence Divergence, MACD Indicator, and Volity, a regulated CFD trading platform. This content is produced for educational purposes only and does not constitute financial advice or a recommendation to buy or sell any financial instrument. Always verify current regulatory status and platform details before using any trading service. Some links in this article may be affiliate links.