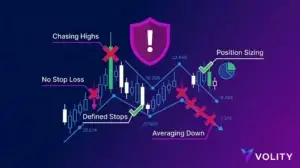
High Sharpe Ratios can mask excessive leverage and tail risk, a fund trading at 2.0+ Sharpe through daily 0DTE option selling faces total liquidation when volatility spikes without warning. The Sharpe Ratio assumes a normal distribution of returns, meaning it systematically underestimates black swan crashes that occur outside the standard deviation bands, a fund that achieved a 2.5 Sharpe in calm markets can collapse 60% in three days when volatility explodes. Comparing Sharpe Ratios across different time periods creates false confidence because current high rates (3.5%-4.5%) inflate ratios versus historical periods when risk-free rates were near zero. Past performance is not indicative of future results. Capital at risk.
The Sharpe Ratio identifies the efficiency of an investment by measuring return relative to total risk. This metric functions as the industry standard for evaluating portfolio manager performance. 2026 data confirms that the S&P 500 maintains a rolling Sharpe Ratio of 2.22, identifying it as a significantly more efficient vehicle than the average hedge fund this year.
While understanding Risk-Adjusted Return Metrics is important, applying that knowledge is where the real growth happens. Create Your Free Forex Trading Account to practice with a free demo account and put your strategy to the test.
What is the Sharpe Ratio and how does it function?
The Sharpe Ratio is a mathematical measurement of the risk-adjusted return of a financial portfolio, identifying the excess profit earned per unit of total volatility. This metric compares the total return of an investment against the risk-free rate baseline (currently Treasury yields near 4%), then divides the difference by the standard deviation, the statistical measure of price volatility. A Sharpe Ratio of 2.0 means an investor receives $2 in excess return for every $1 of standard deviation endured; a 3.0 Sharpe indicates $3 of excess return per unit of risk, making it a vastly superior investment on an efficiency basis.
The inventor William F. Sharpe created this metric in 1966 to address a critical flaw in traditional investing: comparing only absolute returns ignores risk entirely. A portfolio returning 40% but experiencing 80% volatility provides far less efficiency than a portfolio returning 15% with 5% volatility, yet absolute-return comparisons would favor the volatile portfolio. In 2026, the S&P 500 has reached rolling 12-month Sharpe Ratio levels between 2.13 and 3.05, identifying a period of extraordinary risk-adjusted value, according to World P/E Ratio: S&P 500 Sharpe Ratio Performance Tables.
The Risk-Free Rate Baseline (2026)
The risk-free rate identifies the baseline return available from zero-risk assets, currently benchmarking between 3.5% and 4.5% due to 2026 Treasury yields. This rate serves as the denominator for calculating the Sharpe, any investment must exceed the risk-free return to justify the volatility accepted by the investor. When risk-free rates were near zero in 2020-2021, Sharpe Ratios appeared elevated; now that Treasury yields have normalized, the same portfolio’s Sharpe has compressed even if absolute returns remain constant.
The mechanics are straightforward: subtract the risk-free rate from the portfolio return, then divide by standard deviation. A portfolio returning 12% with a 3% risk-free rate and 8% standard deviation yields a Sharpe of (12%-3%) / 8% = 1.125. This calculation instantly reveals whether an investor is being adequately compensated for volatility, a 1.125 Sharpe indicates moderate efficiency, while anything below 0.5 suggests the investor is accepting uncompensated risk.
Ready to Elevate Your Trading?
You have the information. Now, get the platform. Join thousands of successful traders who use Volity for its powerful tools, fast execution, and dedicated support.
Create Your Account in Under 3 MinutesComparing Sharpe Ratios: S&P 500 vs. Hedge Funds
Institutional benchmarks identify the performance gap between passive indices and actively managed hedge fund strategies on a risk-adjusted basis. The passive S&P 500 maintains a rolling 12-month Sharpe Ratio of 2.22 in 2026, while the broad HFRI Composite Index, measuring the average hedge fund performance, lags dramatically at 0.85. This gap reveals that the average hedge fund in 2026 is generating less than half the risk-adjusted return of a simple, low-cost S&P 500 index fund, an outcome that has surprised and frustrated the institutional community.
A typical 2026 top-tier hedge fund maintains a Sharpe Ratio of 0.81, according to Goldman Sachs: 2026 Hedge Fund Alpha Review, placing it in the bottom 25% of risk-adjusted return metrics when compared to the S&P 500 benchmark. This underperformance stems from three factors: management fees (typically 2% annually) drag down net returns significantly, concentrated bets create unnecessary volatility, and the alpha generation that once justified hedge funds has been largely captured by AI-driven quant strategies and passive indices. The “Alpha Gap” between institutions’ expectations and current reality represents the primary crisis in active management today.
How to Calculate and Interpret the Sharpe Ratio
The Sharpe Ratio calculation identifies whether an investor is being adequately compensated for the specific level of market uncertainty they are accepting. The formula is deceptively simple: (Rp – Rf) / σp, where Rp is the portfolio return, Rf is the risk-free rate, and σp is the standard deviation. A Sharpe below 1.0 signals weak efficiency, the investor is accepting volatility without adequate return compensation. A ratio between 1.0 and 2.0 indicates adequate compensation for risk, between 2.0 and 3.0 identifies strong efficiency, and above 3.0 reveals excellent efficiency where returns significantly exceed what volatility would normally justify.
Real trading example: An analyst evaluated a Quant Multi-Strategy Fund (QMS) in March 2026 which delivered an 18% return with a 10% standard deviation, versus a risk-free rate of 4%. The QMS fund achieved a Sharpe Ratio of (18%-4%) / 10% = 1.40, identifying it as a highly efficient “Smart Alpha” play compared to the broad hedge fund average of 0.81. This calculation instantly reveals whether capital should be allocated to QMS: a 1.40 Sharpe indicates the fund is compensating investors adequately for volatility risk, making it a viable alternative allocation alongside the S&P 500. Past performance is not indicative of future results.
2026 Risk-Adjusted Benchmarks by Asset Class
Asset class benchmarks identify the diverse levels of risk-adjusted efficiency across equities, fixed income, and alternative strategies in 2026.
| Asset / Strategy | 2026 Sharpe Ratio | Avg Annual Vol | Performance Tier |
| S&P 500 (SPY) | 2.22 | 15.8% | Excellent |
| Quant Multi-Strat | 1.42 | 8.5% | Strong |
| Fixed Income Arb | 1.35 | 4.2% | Strong |
| Equity Hedge (HF) | 1.02 | 12.0% | Adequate |
| Global Macro (HF) | 0.92 | 14.5% | Weak-Adequate |
| Managed Futures | 0.65 | 18.0% | Weak |
Sources: Data compiled from With Intelligence Hedge Fund Metrics and World P/E Ratio Performance Tables (2026).
The S&P 500 dominates this ranking because it delivers the highest return-per-unit-of-volatility among all asset classes. Quant Multi-Strategy funds rank second, identifying why institutional allocators are increasingly moving capital into AI-driven alpha generation. The steep drop-off from Fixed Income Arbitrage (1.35 Sharpe) to Equity Hedge (1.02 Sharpe) reveals why hedge funds must either reduce fees or improve returns to remain competitive, a 0.33 Sharpe gap translates to substantially different capital allocation decisions in a competitive market.
Sharpe vs. Sortino Ratio: Choosing the Right Metric
The Sortino Ratio identifies risk by focusing exclusively on downside volatility, correcting the Sharpe Ratio’s tendency to penalize positive upward growth. The Sharpe treats all volatility equally, a stock that gains 20% in Week 1 and gains another 20% in Week 2 creates the same standard deviation penalty as one that gains 20% then loses 20%. The Sortino recognizes this flaw by calculating “downside deviation”, only volatility below a specified return target. This distinction matters enormously for growth portfolios: a stock like Nvidia that experiences wild 15% daily swings has a lower Sharpe Ratio than it deserves because half its volatility is explosive upside gains.
Professional analysts now recognize that growth investors should prioritize the Sortino Ratio over Sharpe for portfolio evaluation. Treynor Ratio analysis provides another dimension by measuring returns relative to Beta (systematic market risk) rather than total standard deviation, useful for diversified portfolios where firm-specific volatility is already diversified away. In 2026, institutional managers utilize all three metrics to identify whether their returns are genuine alpha or merely compensation for volatility that could have been diversified into irrelevance.
Turn Knowledge into Profit
You have done the reading, now it is time to act. The best way to learn is by doing. Open a free, no-risk demo account and practice your strategy with virtual funds today.
Open a Free Demo AccountStep-by-Step: Using Sharpe to Optimize Your 2026 Portfolio
Portfolio optimization represents the most effective application of the Sharpe Ratio for balancing high-growth tech with defensive safe-havens. Start by calculating the Sharpe of your current portfolio: gather 12-24 months of historical returns, calculate the average monthly return, subtract the current risk-free rate, then divide by the standard deviation of monthly returns. This reveals your portfolio’s current efficiency baseline, whether your risk exposure is being adequately compensated. Most retail portfolios score between 0.6 and 1.2 Sharpe, identifying room for improvement through better asset allocation.
Next, evaluate potential holdings individually using Sharpe metrics. A technology ETF might deliver a 2.4 Sharpe due to strong 2026 AI-driven gains, while a defensive utility ETF scores only 0.9 Sharpe. However, pairing them together, 60% tech, 40% utilities, often produces a combined portfolio Sharpe of 1.8 or higher due to low correlation, revealing how Portfolio Rebalancing mechanics can enhance efficiency beyond what either holding provides alone. Compare this combined Sharpe against the 2.22 S&P 500 benchmark, if your allocation falls below 1.8, the index fund likely provides superior risk-adjusted returns.
Use Sharpe declines as rebalancing signals. When a position’s Sharpe drops from 2.0 to 1.4 (indicating deteriorating efficiency or rising volatility), rotate capital toward higher-Sharpe alternatives. The Reward-to-Risk Ratio complements Sharpe optimization by focusing on trade-level entry and exit mechanics, while Sharpe focuses on portfolio-level efficiency over months or years. Together, these metrics create a comprehensive framework for capital allocation that prioritizes risk-adjusted returns over absolute performance chasing.
Key Takeaways
- The Sharpe Ratio measures the efficiency of an investment by dividing excess return by the total volatility of the asset.
- Risk-adjusted returns are the primary metric for 2026 performance evaluation, identifying if returns are worth the risk accepted.
- S&P 500 benchmarks have reached historic Sharpe levels above 2.0 in 2026, significantly outperforming active hedge fund strategies.
- The risk-free rate, currently between 3.5% and 4.5%, is a critical variable that must be subtracted to find the true Sharpe value.
- Sortino Ratios offer a more nuanced view for growth investors by ignoring positive upside volatility and focusing only on downside risk.
- A Sharpe above 1.0 is generally considered the threshold for an adequate risk-adjusted investment in the modern 2026 market environment.
Frequently Asked Questions
This article contains references to Sharpe Ratio and Volity, a regulated CFD trading platform. This content is produced for educational purposes only and does not constitute financial advice or a recommendation to buy or sell any financial instrument. Always verify current regulatory status and platform details before using any trading service. Some links in this article may be affiliate links.