A fund with a “good” Treynor score can still hold heavy idiosyncratic risk alongside its systematic exposure, and can fall sharply on a single-name or single-sector reversal despite a moderate Beta. Using Treynor in isolation ignores fat-tail events that can erase a portfolio’s alpha in hours, A correlated shock can push bonds and equities down together, which is exactly when the diversification assumption behind Treynor stops holding. The metric’s reliance on historical Beta is backwards-looking and fails to capture regime shifts when Fed policy or geopolitical conditions fundamentally alter market correlations overnight. Past performance is not indicative of future results. Capital at risk.
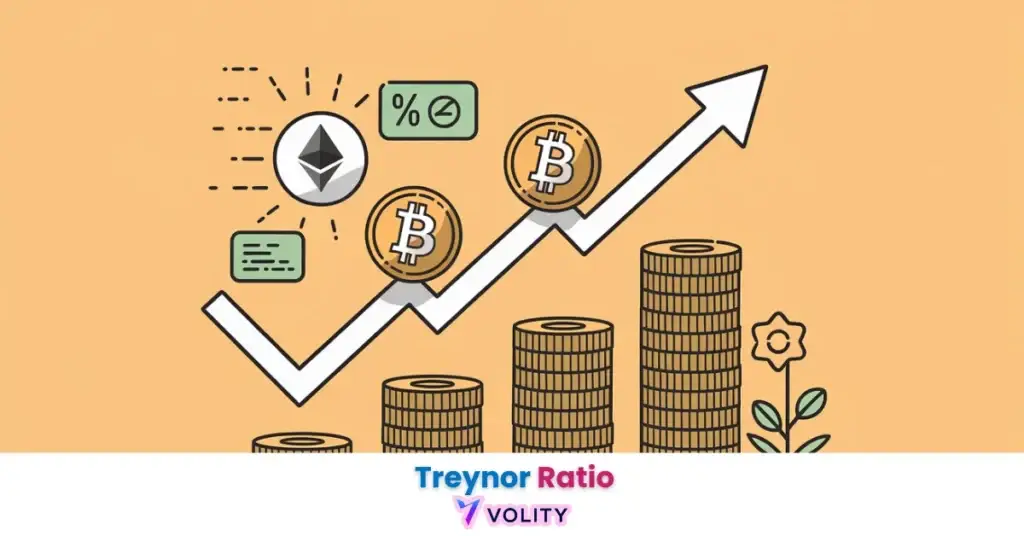
The Treynor Ratio identifies the excess return an investor earns for every unit of systematic risk (Beta) accepted by an investment portfolio. Unlike the Sharpe Ratio, which uses total volatility, Treynor focuses exclusively on market-related risk, making it the primary metric for evaluating well-diversified portfolios and active fund managers. Because the ratio is driven by the excess return over the risk-free rate, a period of strong index returns and a high risk-free rate can produce very different Treynor readings for a broad index and for a low-beta hedged strategy, even when both made money.
While understanding Performance Attribution Metrics is important, applying that knowledge is where the real growth happens. Create Your Free Forex Trading Account to practice with a free demo account and put your strategy to the test.
What is the Treynor Ratio and how does it function?
The Treynor Ratio is a financial metric that measures the excess return earned per unit of systematic risk, identifying the relationship between a portfolio’s profit and its market sensitivity. This metric divides the difference between portfolio return and the risk-free rate by the portfolio’s Beta coefficient. The Three Variables include Portfolio Return (what the investment earned), the Risk-Free Rate (the hurdle, usually taken from a benchmark government bond yield in the portfolio’s own currency), and Beta (the market sensitivity coefficient).
Jack Treynor’s Legacy emphasized isolating “Systematic Risk” because it is critical for diversified investors who have already eliminated company-specific risk through broad holdings. Benchmarking Market Risk uses Beta of 1.0 as the universal baseline for the S&P 500, any Beta below 1.0 means lower market sensitivity, while above 1.0 means higher sensitivity. A broad index has a Beta of 1.0 by construction, so its Treynor Ratio is simply its return minus the risk-free rate. That makes the index the natural comparison point for any fund that claims to add value per unit of market risk.
Treynor vs. Sharpe Ratio: Which is Better?
The Sharpe Ratio identifies risk through total volatility, whereas the Treynor Ratio identifies risk through market sensitivity, making Treynor superior for evaluating well-diversified portfolios. Idiosyncratic Risk versus Systematic Risk reveals that Treynor completely ignores company-specific volatility because diversified investors have already diversified it away. When to use each determines the choice: Single Stock requires Sharpe Ratio (total volatility matters), while Broad Fund requires Treynor Ratio (market beta is what matters).
Ready to Elevate Your Trading?
You have the information. Now, get the platform. Join thousands of successful traders who use Volity for its powerful tools, fast execution, and dedicated support.
Create Your Account in Under 3 MinutesUnderstanding Systematic Risk (Beta) in 2026
Systematic risk identifies the portion of an investment’s volatility that is linked to the overall market movement, serving as the ‘denominator’ in the Treynor calculation. Market Correlation explains why growth and technology names usually carry Betas above 1.0 while utilities sit well below it: the first group rises and falls with broad market sentiment, the second is steadier through the cycle. Concentration Risk explains why a heavy sector weighting in a headline index blurs the line between idiosyncratic and systematic risk, because when one sector dominates the index, “market risk” is increasingly “sector risk”.
Beta Compression describes a hedged strategy that deliberately holds market exposure well below 1.0 and tries to earn its return from selection rather than direction. A fund run that way should be judged on return per unit of beta, which is exactly what Treynor measures, rather than on headline return. Standard Deviation measures historical volatility, providing the mathematical foundation for Beta calculations.
How to Calculate Your Portfolio’s Treynor Ratio
The Treynor Ratio calculation identifies the specific amount of excess return generated for every point of Beta, using the current risk-free rate as the return hurdle. The Step-by-Step Formula uses (Rp – Rf) / βp, where Rp is portfolio return, Rf is the risk-free rate, and βp is portfolio Beta. Sourcing Data requires finding your portfolio’s YTD return and historical Beta from your broker’s performance reporting tools.
A high hurdle rate makes a positive Treynor harder to achieve, because the whole numerator is return minus that hurdle. Worked illustration rather than a record of a specific fund: with a risk-free rate of 4%, a portfolio returning 5% with a Beta of 1.0 scores (5 − 4) / 1.0 = 1.0, barely above the hurdle. A fund returning 14% with a Beta of 0.50 scores (14 − 4) / 0.50 = 20.0, because it produced far more excess return for each unit of market exposure it took. Past performance is not indicative of future results.
2026 Treynor Ratio Benchmarks and Alpha Stats
Performance benchmarks identify the historic divergence between market-cap weighted indices and actively managed non-directional strategies in 2026.
| Asset / Strategy | Typical Market Beta (β) | What drives the Treynor reading | Risk Profile |
| Broad market index | 1.00 by definition | Index return minus the risk-free rate; this is the comparison point, not a score to beat in isolation | Full market exposure |
| Equity hedge | Well below 1.00 | A smaller denominator, so a modest return can still score well per unit of market risk | Selection led |
| Global macro | Low and unstable | Beta moves with positioning, so a single historical Beta can misstate the true exposure | Non-directional |
| Concentrated growth index | Above 1.00 | A larger denominator, so the return has to be proportionally larger to score the same | Amplified market exposure |
| Dividend value | Below 1.00 | Lower excess return against a lower denominator; the two partly cancel | Defensive |
The table above is structural, not a performance benchmark. Read live Beta and return figures from your own fund factsheet or broker reporting, and use the same period and the same risk-free rate for every fund you compare, or the ratios are not comparable.
Limitations of the Treynor Ratio in a Concentrated Market
Idiosyncratic risk indicates that the Treynor Ratio can be misleading for portfolios that are not fully diversified, as it fails to penalize company-specific volatility. The Diversification Assumption means Treynor is dangerous for portfolios with only 1-5 stocks, those holdings carry massive non-market risk that Treynor completely ignores. Fat Tail Risks reveal that Beta does not account for sudden “Black Swan” events or geopolitical shocks; in a correlated sell-off bonds and equities fall together, which invalidates the diversification assumption Treynor depends on.
Negative Beta Paradox explains why gold or inverse ETFs can have negative Treynor Ratios even when profitable, they move opposite the market, so their Treynor is mathematically negative despite providing hedge value. Sharpe Ratio provides a complementary view using total volatility instead of Beta alone.
Turn Knowledge into Profit
You have done the reading, now it is time to act. The best way to learn is by doing. Open a free, no-risk demo account and practice your strategy with virtual funds today.
Open a Free Demo AccountStep-by-Step: Using Treynor to Select the Best Mutual Funds
Fund selection represents the most effective application of the Treynor Ratio for retail investors seeking the highest return per unit of market exposure. Comparing “Like-for-Like” requires using Treynor to compare two Large-Cap Growth funds, if Fund A has Treynor of 12.5 and Fund B has 8.3, Fund A delivers more return per unit of beta. Identifying “Cheap” Returns means avoiding managers who only outperform because they take 2x market risk (Beta of 2.0), their Treynor would be low despite high absolute returns.
Monitoring Drift requires checking if a fund’s Treynor declines as its assets under management (AUM) grow, as funds become larger, they often take on more beta and less alpha. How to Choose Stocks teaches you to evaluate individual names once you’ve narrowed candidates via Treynor screening. Portfolio Rebalancing discipline ensures that your fund selections don’t become over-weighted as winners continue to outperform.
Key Takeaways
- The Treynor Ratio measures the efficiency of a diversified portfolio by dividing excess return by the market beta.
- Systematic risk is the primary denominator for Treynor, identifying the portion of volatility that cannot be diversified away.
- Benchmarking only works like for like: compare two funds over the same period, against the same risk-free rate, before drawing any conclusion from their Treynor scores.
- Treynor vs Sharpe is a critical distinction; use Treynor for diversified portfolios and Sharpe for individual asset analysis.
- The risk-free rate is the hurdle in every risk-adjusted return metric, so a higher rate mechanically lowers every Treynor score.
- Concentration risk in headline indices means that systematic Beta now includes significant tech exposure, which can distort Treynor scores.
Frequently Asked Questions
This article contains references to Treynor Ratio and Volity, a regulated CFD trading platform. This content is produced for educational purposes only and does not constitute financial advice or a recommendation to buy or sell any financial instrument. Always verify current regulatory status and platform details before using any trading service. Some links in this article may be affiliate links.