Energy trading involves extreme price volatility driven by geopolitical instability and rapid supply-demand shifts. Leveraged products like energy CFDs and futures can result in losses exceeding initial deposits.
Ensure you understand the physical and financial nuances of oil and gas markets. Past performance is not indicative of future results.
Capital at risk.
Energy trading reveals a high-stakes financial landscape where global benchmarks like Brent and WTI respond instantly to geopolitical friction. Recent data from the IEA indicates that global oil supply plummeted by 10.1 million barrels per day in March 2026, triggering the largest price-spike cycle since the early 2020s.
Success in these volatile markets requires identifying the transition from traditional fossil fuel dominance to weather-dependent renewable volatility. This guide identifies the primary trading instruments, the 2026 supply-shock benchmarks, and the risk management rules required for professional commodity execution.
While understanding Energy Trading is important, applying that knowledge is where the real growth happens. Create Your Free Forex Trading Account to practice with a free demo account and put your strategy to the test.
By Alexander Bennett, Volity research desk.
What our analysts watch: Three weekly series tell us where the energy tape is really heading. EIA crude inventory builds against the five-year band reveal whether headline supply shocks are biting or only signalling.
Refining margins, especially the 3-2-1 crack, separate genuine demand strength from speculative front-month flows. And Henry Hub forward curves measured against European TTF show the LNG arbitrage that decides where U.S. exports actually land.
When all three move in the same direction at once, the trend usually has another quarter to run.
Ready to Elevate Your Trading?
You have the information. Now, get the platform. Join thousands of successful traders who use Volity for its powerful tools, fast execution, and dedicated support.
Create Your Account in Under 3 MinutesHow does energy trading work in physical and financial markets?
The retail-friendly route for energy exposure is via CFDs.
Energy trading operates through two distinct channels: physical markets for actual delivery and financial markets where traders speculate on price movements via derivatives.
Physical trading involves managing the entire supply chain: producers pump crude oil from offshore platforms, tanker fleets transport it across international waters, and refineries convert it into usable products. This logistical complexity creates months-long settlement cycles where storage tanks must maintain buffer inventory and pipeline operators manage pressure across thousands of kilometers. Financial trading circumvents these complications by using futures contracts on exchanges like NYMEX (New York Mercantile Exchange) where buyers and sellers never touch physical barrels. Options and CFDs further democratize access, allowing retail traders to speculate on energy price direction with leverage as high as 20:1.
Most retail traders prefer cash settlement because they avoid forced delivery complications: a physical oil contract executed incorrectly can obligate a trader to own 1,000 barrels of crude oil delivered to a specific tank, creating financial and logistical nightmares. The Mastering futures contract gold mechanics guide explains how futures margin works and why contract expiration dates matter for traders maintaining positions.
What are the main energy trading markets in 2026?
The main energy trading markets in 2026 deliver deep liquidity through crude oil benchmarks, regional natural gas hubs, and evolving renewable energy platforms.
Crude oil dominates the energy trading landscape with Brent (the global benchmark priced in the North Sea) and WTI (West Texas Intermediate, the US-focused benchmark) accounting for over 80% of all energy derivative volume. Natural gas trades at multiple regional hubs where Henry Hub in Louisiana establishes US pricing and the Dutch TTF (Title Transfer Facility) sets European pricing. In 2026, Henry Hub prices surged to $4.30 per million British thermal units due to record liquefied natural gas (LNG) exports to Europe, while TTF reached €48.60 per megawatt-hour reflecting extreme supply tightness. Electricity markets on platforms like EPEX Spot in Germany now trade “intraday power” where prices fluctuate minute-by-minute based on real-time solar and wind output, creating opportunities for traders who can forecast weather patterns faster than the market consensus.
The scope of supply disruption in March 2026 was historic: global observed inventories fell by 85 million barrels in a single month following Middle East disruptions (IEA, April 2026). This inventory drawdown compressed the contango (near-term prices trading below future prices), shifting the entire futures curve structure and triggering cascading liquidations in leveraged hedge funds.
The central banks influence energy and gold prices guide explains how central bank policy announcements ripple through commodity markets because interest rate changes affect the cost of carrying inventory.
What drives energy prices in the 2026 geopolitical regime?
Energy price drivers are a combination of traditional supply-demand fundamentals and the structural “geopolitical risk premium” inherent in modern maritime chokepoints.
Supply shocks dominate the 2026 energy narrative: the Strait of Hormuz, through which 27% of all global seaborne oil exports flow, experienced closure events in March that removed 10.1 million barrels per day from the market. This interruption, combined with damage to Qatari LNG export facilities, created a “perfect storm” where global supply contracted faster than demand could naturally collapse. Demand destruction followed as crude oil prices spiked, industrial users cut production, and the IEA revised 2026 global demand downward by 730 thousand barrels per day, the sharpest revision since the COVID-19 pandemic of 2020. OPEC+ (Organization of the Petroleum Exporting Countries Plus Russia) faced a strategic dilemma: defend the $60 per barrel price floor by cutting output, or cede market share to non-OPEC producers like the United States, Brazil, and Guyana who expanded production unconstrained by cartel discipline.
The IEA: Oil Market Report – April 2026 documents that the 10.1 million b/d supply shock and demand contraction represent the most severe market disruption in over five years. The geopolitical risk premium, the extra price investors demand for holding energy contracts, can account for $15-$25 per barrel during acute crisis periods, a dynamic that must be monitored via the Forex market sentiment indicators guide to time entry and exits.
How do beginners start energy trading safely?
Starting energy trading as a beginner requires a transition from emotional news-trading to a disciplined strategy focused on liquid benchmarks like WTI oil or US natural gas.
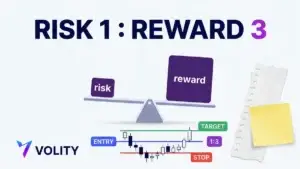
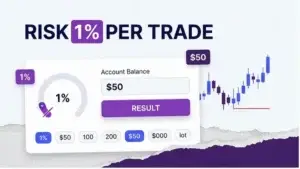
The path to professional energy trading begins with broker selection: a regulated dealer offering direct market access (DMA) or API connectivity minimizes execution slippage compared to market maker brokers that profit from the spread between their bid and ask prices. Demo trading is non-negotiable, beginners must practice “spread trading” strategies like buying Brent and simultaneously selling WTI to profit from the price premium Brent commands over US grades. This hedge eliminates directional risk while establishing a trading framework that survives even the most severe geopolitical shocks. Leverage management is the third pillar: while some brokers offer 100:1 leverage on energy CFDs, professional traders rarely exceed 10:1 because a 10% adverse move in a leveraged position already produces margin call notifications.
A real trading example from 2026 illustrates this discipline: a trader bought a Brent Crude CFD contract at $92.00 following the March Hormuz stabilization event. When Brent subsequently hit $107.00 during the supply peak in early April, the position generated a 16% gain before leverage considerations. Past performance is not indicative of future results. This example demonstrates the opportunity set available during geopolitical disruptions, but also highlights the execution risk, slippage, gaps, and sudden reversals can eliminate gains as rapidly as they accumulate.
The gold trading for beginners common mistakes guide covers position sizing and leverage rules that apply equally to energy contracts as they do to precious metals.
2026 Global Energy Benchmarks
Energy benchmarks reveal the current price targets and supply/demand metrics across the world’s primary power commodities.
| Entity | Early 2026 Status | Mid-2026 Forecast | Source |
| Brent Crude | ~$78 / bbl | $92.00 – $120.00 (Peak) | (Source: IEA) |
| Henry Hub Gas | $3.15 / MMBtu | $4.01 – $4.30 | (Source: EIA) |
| TTF (European Gas) | €27.61 / MWh | €48.60 – €60.00+ | (Source: Bloomberg) |
| Global Oil Demand | +830 kb/d | -80 kb/d (Contraction) | (Source: IEA) |
| LNG Export (US) | 12.0 Bcf/d | 17.0 Bcf/d (Record) | (Source: EIA) |
Sources: IEA Oil Market Report (April 2026), EIA Short-Term Energy Outlook, Bloomberg Energy Data
Turn Knowledge into Profit
You have done the reading, now it is time to act. The best way to learn is by doing. Open a free, no-risk demo account and practice your strategy with virtual funds today.
Open a Free Demo AccountKey Takeaways
- Energy trading involves profiting from price shifts in oil, gas, electricity, and emerging renewables.
- March 2026 witnessed a record 10.1 million b/d supply shock due to geopolitical conflict in the Middle East.
- Brent crude surged to a peak of $107 in March before stabilizing near $92 per barrel in late April 2026.
- U.S. natural gas (Henry Hub) reached a 2026 high of $4.30 driven by record LNG export demand.
- The IEA predicts a demand contraction of -80 kb/d for 2026, the sharpest decline since the 2020 pandemic.
- Trading renewables (wind/solar) requires monitoring real-time weather patterns rather than traditional storage data.
Frequently Asked Questions
This article contains references to energy trading, oil, natural gas, and Volity, a regulated CFD trading platform. This content is produced for educational purposes only and does not constitute financial advice or a recommendation to buy or sell any financial instrument. Always verify current regulatory status and platform details before using any trading service. Some links in this article may be affiliate links.
[/coi_disclosure]
Volity operates a trading platform and also publishes educational and analytical content about trading. The content on this page is for educational purposes only and should not be considered financial advice. Volity may benefit commercially when readers open trading accounts through links on this site.
Our content is produced and reviewed under documented editorial standards; comparison and review methodology is published here.