Range-bound market trading involves specific risks including false breakouts, liquidity sweeps that trigger stop-losses, and the psychological challenge of fading price action at established boundaries. Leverage amplifies both gains and losses in sideways markets. Always use risk management tools such as ATR-based stops and position sizing aligned with your account equity. Past performance is not indicative of future results. Capital at risk.
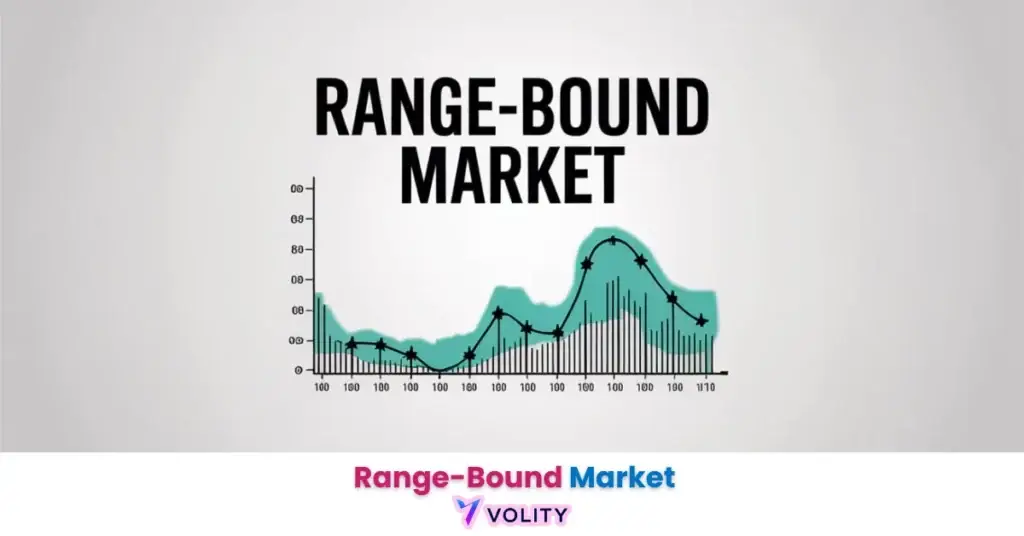
A range-bound market is a price environment where assets trade within a horizontal corridor without establishing a trend. In 2026, 79% of US institutional investors anticipate market corrections, leading to increased adoption of mean reversion tactics in sideways regimes. This guide identifies how to navigate these “box” patterns using technical indicators and disciplined risk management.
Range-bound market dynamics function as a “pendulum” where buyers and sellers maintain a temporary equilibrium between horizontal boundaries. This market state requires a fundamental shift from trend-following logic to a strategy focused on exhaustion and reversion. It remains the most common market condition, appearing in roughly 70-80% of all global trading sessions.
The 2026 investment landscape is defined by central bank “simultaneous holds,” which has compressed volatility across major currency pairs and commodities. Successful traders utilize these periods of “chop” to accumulate consistent gains while awaiting the next major fundamental catalyst.
While understanding Forex is important, applying that knowledge is where the real growth happens. Create Your Free Forex Trading Account to practice with a free demo account and put your strategy to the test.
How do I identify a range-bound market in 2026?
A range-bound market is a technical formation identified by the absence of higher highs and lower lows over a sustained period.
Visual identification reveals the “support” (floor) and “resistance” (ceiling) zones where price bounces repeatedly. The horizontal consolidation filters out false signals from noise, allowing traders to focus on only the highest-probability entries. Using the ADX (Average Directional Index) below 25 confirms a non-trending state—when this indicator remains suppressed, sideways conditions dominate.
Financial markets are estimated to remain in range-bound states for approximately 75% of the time in 2026 (Quantified Strategies, 2026). This statistic underscores why identifying these patterns is critical for consistent profitability.
The three key visual markers are:
- Horizontal support level where price repeatedly bounces upward
- Horizontal resistance level where price repeatedly rolls over
- Oscillating price action between these two boundaries without breaking to new levels
Ready to Elevate Your Trading?
You have the information. Now, get the platform. Join thousands of successful traders who use Volity for its powerful tools, fast execution, and dedicated support.
Create Your Account in Under 3 MinutesWhat is the best indicator for range trading in 2026?
Momentum oscillators and volatility bands are the primary indicators used to determine overbought and oversold conditions in a range-bound market.
The Relative Strength Index (RSI) trades the 70/30 extremes for entries—when RSI climbs above 70, the asset is overbought and likely to revert downward; when it drops below 30, oversold conditions often precede upward bounces. Bollinger Bands identify “squeezes” and mean reversion to the 20-period moving average, making them ideal for sideways price action. The Stochastic Indicator uses the %K and %D crossovers for timing in low-volatility environments.
Institutional traders in 2026 have integrated retail-flow analysis into their execution strategies to exploit “overshoot and normalize” patterns—75% of major desks now track this data (Sahm Capital, 2026). The best approach combines two of these oscillators for confirmation rather than relying on a single indicator.
Is range trading more profitable than trend following?
Profitability in range-bound markets is determined by the frequency of high-probability setups rather than the magnitude of individual price moves.
“Monster Moves” in trending markets can generate large percentage gains, but they occur infrequently. “Consistent Bounces” in ranges happen multiple times per day, allowing disciplined traders to accumulate steady gains. The psychological discipline required to “fade” price action at boundaries is higher than trend-following because you must bet against the initial breakout momentum.
Real trading example: EUR/USD traded in a 50-pip range for three weeks in Q1 2026. A trader bought at the 1.0850 support level after an RSI oversold signal. The price reverted to the 1.0875 median within 48 hours, yielding a 25-pip gain before reversing again. Past performance is not indicative of future results.
Impact of transaction costs and spreads matters significantly in narrow ranges—if your spread is 2 pips but your average move is 10 pips, the spread cost represents 20% of your potential profit. This is why choosing a low-spread broker and understanding how to calculate lot size are essential for range trading success.
How do I avoid false breakouts in a sideways market?
Fakeout detection identifies the specific price action signals that distinguish a true range expansion from a temporary liquidity sweep.
| Metric | 2026 Market Trend | Strategy Adjustment |
| Fakeout Frequency | 65% of initial breakouts | Wait for candle close back inside range |
| Institutional Flow | Priority on “Stop Hunting” | Look for high volume at range extremes |
| Retail Margin Debt | $1.3 Trillion (Record) | Anticipate forced liquidations at key levels |
| AI Detection | 88% adoption by major desks | Use Volume Profile to find “Fair Value” nodes |
| Volatility Spikes | Compression followed by 3x expansion | Monitor ADX for momentum shifts |
Sources: Morgan Stanley and JP Morgan Research (2026)
The most reliable fakeout signal is a candle that breaks above resistance or below support but then closes back inside the range within the same session. High volume during the breakout often indicates institutional participation—if volume remains low, retail stop-losses are being hunted, and a reversal is likely.
Use the ATR (Average True Range) to adjust your stop-loss distance; in a range-bound market, market noise often triggers tight stops placed exactly at the support or resistance line.
Where should I place my stop-loss in a range-bound strategy?
Effective risk management in a range-bound market involves placing protective stops outside the zone of volatility ‘noise’ to avoid premature exits.
The “Zone of Noise” explains why placing stops exactly at support/resistance fails—this is the highest-liquidity area where institutional traders and market-makers trigger retail stops. Using ATR-based stops adds a multiplier (e.g., 1.5x ATR) to the range boundary, ensuring your stop sits outside the noise. For example, if support is at 1.0850 and ATR is 10 pips, place your stop at 1.0840 (below support + 1x ATR) rather than exactly at 1.0850.
The 2% Rule ensures no single range trade risks more than 2% of total equity. If your account is $10,000, each trade should risk a maximum of $200. This position-sizing discipline preserves capital during inevitable drawdowns.
WARNING: Sideways markets often precede massive volatility expansions; always monitor the ADX (Average Directional Index)—if it starts rising from below 20, a range breakout is likely imminent.
💡 KEY INSIGHT: 2026 “Liquidity Sweeps” are common in range trading, where price briefly pierces a level to trigger stop-losses before reversing back into the range—this is known as a ‘fakeout.’
Turn Knowledge into Profit
You've done the reading, now it's time to act. The best way to learn is by doing. Open a free, no-risk demo account and practice your strategy with virtual funds today.
Open a Free Demo AccountHow does AI impact range-bound trading in 2026?
Artificial intelligence identifies volatility contraction patterns and automates the detection of high-volume nodes within sideways ranges.
AI Copilots spot “breaks” in liquidity before they appear on standard charts by analyzing order flow data and institutional positioning. Automated Range Mapping algorithms draw support/resistance based on tick-level data, creating dynamic boundaries that adapt as the range widens. When combined with technical analysis frameworks, these tools allow traders to identify range formation earlier and enter with higher confidence.
The Rectangle Chart Pattern is the classical formation that AI now detects in real-time, enabling traders to set up range-trading strategies with institutional-grade precision.
Key Takeaways
- Range-bound markets are price regimes where assets oscillate between horizontal support and resistance levels without a clear trend.
- Mean reversion is the primary strategy for range trading, focusing on buying at support and selling at resistance boundaries.
- RSI and Stochastics are essential indicators for identifying overbought and oversold conditions during periods of sideways price action.
- False breakouts or ‘fakeouts’ occur in 65% of initial range expansions in 2026, requiring traders to wait for confirmation candles.
- Risk management in ranges requires placing stop-losses beyond the ‘zone of noise’ using ATR-based adjustments.
- Volatility compression in a range often precedes a massive expansion, making the monitoring of the ADX indicator a critical task.
Frequently Asked Questions
This article contains references to Range-Bound Markets, Technical Indicators, and Volity, a regulated CFD trading platform. This content is produced for educational purposes only and does not constitute financial advice or a recommendation to buy or sell any financial instrument. Always verify current regulatory status and platform details before using any trading service. Some links in this article may be affiliate links.