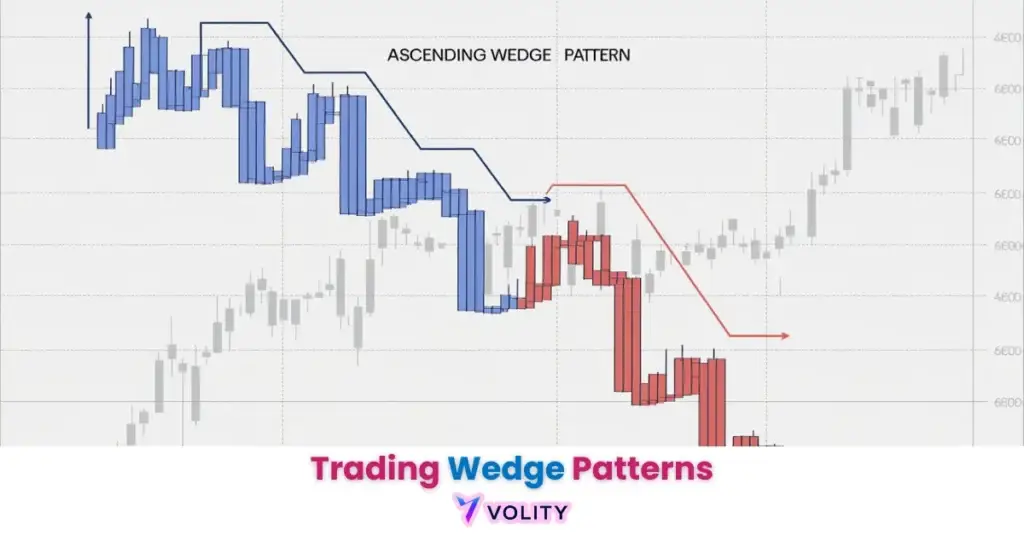
Wedge patterns are prone to false breakouts in low-liquidity conditions; rising wedges especially generate “bull trap” fakeouts where price breaks above the upper trendline only to reverse when retail traders’ stops are hit. The touch requirement is not absolute; Bulkowski asks for at least five touches across the two trendlines, and a thinly touched pattern is far easier to draw than to trade. Heavy breakout-day volume improves a bullish wedge, but crypto wedges frequently break on ordinary volume, creating false signals that trap traders. Apex drifting creates sideways choppy action that invalidates the pattern entirely, but many traders hold losing positions hoping for a delayed breakout. Wedge patterns become unreliable during high-impact news events like NFP or central bank decisions, when institutional flow overwhelms technical structure. Past performance is not indicative of future results. Capital at risk.
Wedge patterns are technical chart formations characterized by two converging trendlines that signal a “volatility squeeze” before a breakout. On Thomas Bulkowski’s tested bull-market sample, a falling wedge breaks out upward 68% of the time and 26% of those upward breakouts fail to travel 5% past the breakout, while a rising wedge breaks downward 60% of the time and 51% of those downward breakouts fail the same test. Both rank in the bottom half of his tables, so a wedge is a structure to trade carefully rather than a high-probability edge.
Wedge patterns function as primary structural indicators of an impending market breakout. These formations consist of two converging trendlines that slope in the same direction, signaling that the current trend is losing steam while volume contracts. In the 2026 technical landscape, they represent the ultimate “coiled spring” for both reversal and continuation setups.
The effectiveness of a wedge depends heavily on its “maturity” and the accompanying volume signature. As markets become increasingly algorithmic, traders must distinguish between valid structural wedges and temporary price noise by applying the “Rule of Three” touch verification.
While understanding Trading Wedge Patterns is important, applying that knowledge is where the real growth happens. Create Your Free Forex Trading Account to practice with a free demo account and put your strategy to the test.
What are wedge patterns and how do they form?
A wedge pattern is a chart formation characterized by two converging trendlines that slope in the same direction, indicating a period of price consolidation and diminishing momentum. Unlike symmetrical triangles where trendlines slope toward each other at different angles, wedges maintain parallel slope directions, either both downward or both upward.
- The Falling Wedge (Bullish Bias): Converging downward slopes signaling seller exhaustion and potential reversal toward higher prices
- The Rising Wedge (Bearish Bias): Converging upward slopes signaling buyer exhaustion and potential reversal toward lower prices
- The touch test: Bulkowski asks for at least five touches in total, three on one trendline and two on the other, and a minimum duration of three weeks; anything shorter is a pennant
Falling wedges break out upward 68% of the time on Bulkowski’s bull-market sample of more than 800 trades. Breakout direction is not the same thing as performance: he ranks the falling wedge 31st of 39 patterns with upward breakouts and calls it a poor performer, so the direction bias is a starting point rather than an edge.
The “Apex Squeeze” and Volatility Expansion
Volatility expansion identifies the price move that follows the breakout. Bulkowski measures the average breakout at 61% to 62% of the way to the apex for a falling wedge and 67% for a rising wedge, so most patterns resolve well before the trendlines actually meet. The tightening converging trendlines create a “toothpaste tube” analogy where price is compressed into an ever-narrower range, storing potential energy.
Volume contraction during the formation is a non-negotiable requirement, if volume remains elevated during wedge development, the pattern fails to compress price into the necessary tight range. Volume trends downward until the breakout in 72% to 75% of falling wedges and 79% of rising wedges, and bullish wedges that break out on heavy volume perform better than those that do not.
Ready to Elevate Your Trading?
You have the information. Now, get the platform. Join thousands of successful traders who use Volity for its powerful tools, fast execution, and dedicated support.
Create Your Account in Under 3 MinutesStatistical Performance: Falling vs. Rising Wedges in 2026
Comparative performance data in 2026 identifies a significant reliability gap between bullish falling wedges and bearish rising wedges. This asymmetry reflects that reversals from support (falling wedges) carry higher conviction than reversals from resistance (rising wedges).
Falling Wedge (Bullish): 26% of upward breakouts fail to run 5% past the breakout, and the average rise across the rest is 38%, measured on US stocks. Rising Wedge (Bearish): 51% of downward breakouts fail that same test and the average decline is 9%, which is why Bulkowski ranks the rising wedge last of the 36 patterns with downward breakouts. Throwbacks and pullbacks are the norm rather than the exception: 62% to 74% of breakouts return to the trendline first, so a trader who exits on the initial move captures only part of it.
The published statistics are drawn from US stocks. No comparable tested sample exists for gold, FX or crypto wedges, so treat any per-asset “success rate” quoted for those markets as an assertion rather than a measurement.
Market Volatility regimes determine whether wedges remain clean or become distorted; extreme volatility periods often see apex drifting invalidate patterns before breakout occurs.
Count the touches before you trade the pattern: Bulkowski wants at least five between the two trendlines, three on one and two on the other, over a formation lasting three weeks or more.
Step-by-Step Strategy: Trading the Wedge Breakout
The confirmation Bulkowski actually tests is a close outside one of the trendlines; heavy breakout-day volume is a quality filter on top of it, not a substitute for it. Professional traders follow a four-step playbook that filters false breakouts before committing capital.
Identification involves drawing two converging trendlines that slope the same way, with at least five touches between them and a formation at least three weeks long. Confirmation requires a close outside one of the trendlines, with heavy breakout-day volume treated as a quality filter rather than a threshold. Entry choices depend on risk tolerance, the conservative “Retest Entry” waits for price to retrace back to the broken trendline before entering, while the aggressive “Momentum Close” enters immediately when the candle closes beyond the trendline. Targeting uses the “Measured Move” calculation by measuring the wedge’s height (from top of apex to bottom of apex) and projecting that distance from the breakout level.
Worked through Bulkowski’s own measure rule: take the height from the highest peak to the lowest valley in the pattern, multiply it by the percentage that historically meets the target, which is 62% for a falling wedge breaking upward, and add the result to the breakout price. That produces a target the statistics support, rather than the full pattern height, which they do not. Past performance is not indicative of future results.
WARNING: Beware of “Apex Drifting” where the price exits the wedge sideways without a volume spike; these formations invalidate the pattern and indicate a shift from a trending regime to a choppy, range-bound market.
Why Wedge Patterns Fail: Identifying the “Apex Trap”
Statistical analysis of failed patterns identifies that low volume and apex drifting are the primary drivers of wedge pattern invalidation. A wedge requires multiple conditions to align simultaneously for a successful breakout.
| Wedge and breakout | How often it breaks that way | Break-even failure rate | Average move | Throwback / pullback |
| Falling wedge, upward | 68% | 26% | +38% | Throwback 62% |
| Falling wedge, downward | 32% | 29% | -14% | Pullback 74% |
| Rising wedge, upward | 40% | 19% | +38% | Throwback 72% |
| Rising wedge, downward | 60% | 51% | -9% | Pullback 72% |
Bull-market statistics from Thomas Bulkowski’s Falling Wedge and Rising Wedge pages, built on more than 800 and more than 1,400 perfect trades respectively.
Read down the failure-rate column rather than the direction column. A falling wedge breaking upward is the best of the four cases and still fails the 5% test one time in four; a rising wedge breaking downward, the case most guides describe as the reliable bearish signal, fails more often than it works. Sideways drift at the apex is not in the tested set at all, which is a reason to stand aside rather than a reason to hold.
💡 KEY INSIGHT: The 38% average rise is a US-stock figure measured across the patterns that survived the break-even test, and it sits alongside a 26% failure rate and a bottom-half performance rank. Quote the whole set or none of it.
Turn Knowledge into Profit
You have done the reading, now it is time to act. The best way to learn is by doing. Open a free, no-risk demo account and practice your strategy with virtual funds today.
Open a Free Demo AccountBest Timeframes and Asset Classes for Wedge Trading
Higher timeframes like the 4-hour and Daily charts provide the cleanest wedge signals by filtering out intraday algorithmic noise. The additional context of higher timeframes allows traders to evaluate whether wedges form within larger bullish or bearish trends, increasing the probability of successful breakouts.
Gold (XAU/USD) is the most reliable asset for falling wedge continuations in 2026, with clean price action and consistent volume expansion during breakouts. Crypto benefits from 24/7 liquidity making 4H wedges “gap-free” and more technically accurate than forex pairs that experience overnight gaps. Forex presents challenges because NFP-driven volatility often breaks wedges before they reach the apex, requiring traders to exit prematurely when economic data surprises.
technical indicators for trading frameworks integrate wedge recognition into automated systems; traders can use scanners to find patterns across multiple assets and timeframes simultaneously.
Difference Between Wedge, Pennant, and Flag Patterns
Structural analysis reveals that wedges, pennants, and flags differ in their trendline slopes and duration. Pennants have two converging trendlines that slope in opposite directions (like a symmetrical triangle), while flags are tight rectangular consolidations without converging lines. Wedges maintain parallel-sloped converging trendlines, making them visually distinct from both pennants and flags despite serving similar volatility expansion functions.
The directional bias also differs, wedges inherit directional bias from the preceding trend, while pennants and flags are pure continuations. Traders must distinguish between these patterns to avoid false entries, as a flag pattern invalidates after a failed close beyond the consolidation high, while a wedge remains valid as long as price stays within the trendlines.
Key Takeaways
- Wedge patterns are chart formations with two converging trendlines that slope in the same direction, indicating price consolidation before a breakout.
- Falling wedges break out upward 68% of the time; 26% of those upward breakouts fail to travel 5% past the breakout, against 51% for rising-wedge downward breakouts.
- Bulkowski asks for at least five trendline touches and a three-week minimum duration; a shorter converging formation is a pennant, not a wedge.
- Volume trends downward through the formation in roughly three quarters of wedges, and heavy volume on the breakout day is associated with better bullish performance.
- The “Measured Move” technique uses the wedge height to project target levels, allowing traders to set risk-reward ratios before entry.
- Apex drifting (sideways action at the apex without volume expansion) invalidates the pattern and signals a shift to choppy, range-bound markets.
Frequently Asked Questions
This article contains references to Trading Wedge Patterns, Chart Patterns, and Volity, a regulated CFD trading platform. This content is produced for educational purposes only and does not constitute financial advice or a recommendation to buy or sell any financial instrument. Always verify current regulatory status and platform details before using any trading service. Some links in this article may be affiliate links.