Technical indicators like Fibonacci retracement provide statistical probabilities but do not guarantee market direction. High leverage in Forex trading increases risk of capital loss. Past performance is not indicative of future results. Capital at risk.
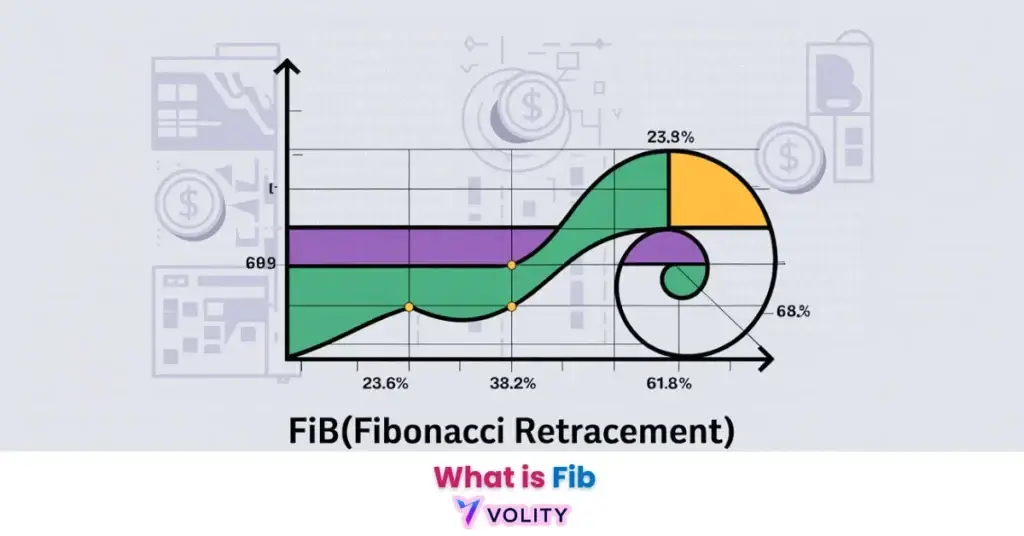
Fibonacci retracement (FIB) is a technical analysis tool used to identify support and resistance zones based on mathematical ratios. It reveals specific price zones, most notably 61.8% and 78.6%, where trends often pause or reverse. In 2026, it remains a cornerstone of trend-following strategies when combined with RSI and MACD confluence.
Fibonacci retracement identifies critical support and resistance zones by dividing a prior price move into mathematical percentages. It reveals potential turning points where buyers or sellers may re-enter the market after a temporary pullback. As of 2026, professional traders rely on these “FIB” levels to remove subjectivity from their entry and exit decisions in volatile Forex pairs (Volity Research, 2026).
The tool is based on the Fibonacci sequence, a series of numbers that creates ratios common in both nature and financial markets. While many indicators lag, Fibonacci levels are leading indicators, marking out potential reaction zones before the price even reaches them.
While understanding Fibonacci Retracement (FIB) is important, applying that knowledge is where the real growth happens. Create Your Free Forex Trading Account to practice with a free demo account and put your strategy to the test.
What Alexander Bennett watches: Fibonacci is a self-fulfilling tool that gains weight through wide adoption, but it produces false signals constantly when used without context. Three filters separate disciplined Fib trading from random level-hunting. Anchor-point selection: the swing high and swing low used to draw the levels must be objective higher-timeframe pivots, not subjective intraday peaks chosen to make the pattern fit. Confluence with non-Fib structure: a 61.8 percent retracement that aligns with a prior daily high, a 50-period moving average, or a key session level is materially stronger than an isolated Fib level. And reaction quality at the level on first touch: a sharp rejection candle with volume is the actionable signal; a slow grind through the level usually means the move has more depth to retrace. Without all three, Fib retracement is decoration rather than analysis.
Ready to Elevate Your Trading?
You have the information. Now, get the platform. Join thousands of successful traders who use Volity for its powerful tools, fast execution, and dedicated support.
Create Your Account in Under 3 MinutesHow do traders draw Fibonacci retracement levels correctly?
Pair Fibonacci with trend lines for stronger confluence.
Drawing Fibonacci retracement levels requires identifying a distinct swing high and swing low and dragging the tool from left to right across the price range. The primary debate among traders revolves around whether to use candle wicks (the extreme highs/lows including shadows) or bodies (the opening and closing prices). Professional traders universally favor wicks because they capture the full extent of buying and selling pressure, including stop orders that execute beyond normal trading range. Drawing in an uptrend proceeds from Low to High (dragging from the recent swing low upward to the recent swing high), while downtrend analysis reverses to High to Low. The “left to right” rule remains essential for standardizing analysis: drawing from right-to-left produces inverted percentage levels that produce false signals (Volity Research, 2026).
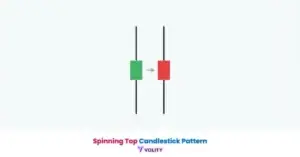
how to read candlesticks explains candle anatomy and how wicks versus bodies reflect different trader psychology and execution dynamics.
BabyPips Fibonacci retracement levels provides step-by-step guidance for drawing Fibonacci levels on trading platforms like MetaTrader and using them in live trading scenarios (BabyPips, 2026).
What is the 61.8% Fibonacci level and why is it important?
The 61.8% Fibonacci level reveals the “Golden Ratio” of financial markets, acting as the most significant institutional floor for trend continuations in 2026. The mathematical derivation of 0.618 emerges from the Fibonacci sequence itself: as the sequence progresses, the ratio between consecutive numbers approaches 1.618 (the inverse being 0.618). Psychology creates institutional preference for the 61.8% level: major banks literally teach traders that this ratio matters most, so every algorithm and manual trader places defensive orders near this level. When price drops 61.8% of a previous rally, it psychologically signals “controlled pullback”, buyers interpret this as institutional support and position aggressively (Forex.com, 2026).
Statistical success rates demonstrate 61.8% superiority over the shallow 38.2% level in major pairs like EUR/USD: the 61.8% level shows reversal success rates approximately 20% higher than the 38.2% level because it captures institutional order placement more accurately.
Fibonacci sequence explains the mathematical underpinnings of the 0.618 ratio and how it appears throughout nature, finance, and architecture as a universal constant.
Fibonacci Statistics and 2026 Strategy Confluence
Fibonacci strategy performance reveals superior accuracy when levels align with other technical indicators to create high-probability confluence zones. A single Fibonacci level trading at 61.8% shows approximately 65-70% success rates in major pairs, but confluence with a moving average or RSI divergence increases success to 80%+ across large sample sizes.
| Entity | Success Level | Context | 2026 Benchmark |
| 61.8% Level | High | Golden Ratio Reversal | Institutional Favorite |
| 78.6% Level | Moderate-High | Deep Retracement | Stop-Hunt Zone |
| 50.0% Level | Moderate | Psychological Midpoint | Not a true Fib number |
| 38.2% Level | Moderate | Shallow Pullback | Strong Trending Markets |
| 23.6% Level | Low | Immediate Correction | Scalping Only |
Sources: Volity Research, Forex.com 2026 performance data
Simple Moving Average (SMA) documents how moving averages create confluence zones when they align with Fibonacci levels, dramatically improving statistical edge for trend-following traders.
What’s the difference between Fibonacci retracement and extension?
Fibonacci retracements measure pullbacks within an existing price move, whereas extensions identify potential profit targets beyond the previous swing high or low. The primary use case distinction clarifies strategy: retracements serve entry purposes (buyers identify where to add positions after dips), while extensions serve exit purposes (traders project where trends exhaust and price reverses). The mathematical link proves elegant: a 61.8% retracement in an uptrend often projects to a 161.8% extension as the profit target for that trade. This creates a complete trade plan: identify the retracement level for entry, then immediately plot the extension level for exit without needing to calculate a new target.
Real trading example: EUR/USD rallied from 1.0800 to 1.1200 (+400 pips), then pulled back to the 61.8% retracement at 1.0952. Bulls recognized this institutional support and re-entered aggressively. Targeting the 161.8% extension from the original low calculated as: 1.0800 + (1.0800 to 1.1200 distance × 1.618) = 1.1448. Traders entered at 1.0952 and exited at 1.1448 for a 496-pip profit. Past performance is not indicative of future results.
Fibonacci extensions provides detailed guidance on plotting extension levels and using them as precise profit targets within a complete Fibonacci trading system.
Common Fibonacci Mistakes in Forex Trading
Fibonacci failure often requires traders to recognize mistakes such as ignoring long-term trend alignment or using the tool on excessively short timeframes. Mistake 1 involves relying on FIB alone without confluence, a 61.8% level isolated from other indicators shows higher false signal rates than combined analysis. Mistake 2 involves mixing wicks and bodies inconsistently: if a trader uses candle wicks for the swing low but the candle body for the swing high, the calculated percentages will be incorrect. Mistake 3 involves counter-trend trading, attempting to short rallies that approach Fibonacci levels from below when the macro structure clearly shows an uptrend. Professionals acknowledge that Fibonacci works best in trending environments; range-bound markets with chop around the same price levels produce whipsaws that stop out entries (Volity Research, 2026).
Turn Knowledge into Profit
You have done the reading, now it is time to act. The best way to learn is by doing. Open a free, no-risk demo account and practice your strategy with virtual funds today.
Open a Free Demo Accountsupport and resistance levels explains traditional structural support/resistance and why Fibonacci levels complement, rather than replace, price action-based analysis.
Forex.com Fibonacci analysis documents common Fibonacci trading mistakes and how professional traders validate levels before executing (Forex.com, 2026).
Key Takeaways
- Fibonacci retracement identifies potential price reversal points by dividing a trend range into mathematical ratios.
- Fibonacci levels of 61.8% and 78.6% reveal the strongest institutional support and resistance zones in 2026.
- Fibonacci drawing techniques must use major swing highs and lows to maintain analysis accuracy across different pairs.
- Fibonacci 50% levels act as psychological midpoints, though they are not technically part of the Fibonacci number sequence.
- Fibonacci retracements differ from extensions by focusing on pullbacks for entries rather than projecting profit targets.
- Fibonacci risk management involves setting stop-losses just beyond the next level to protect against invalidations.
Frequently Asked Questions
This article contains references to Fibonacci retracement analysis, technical analysis, and Volity, a regulated CFD trading platform. This content is produced for educational purposes only and does not constitute financial advice or a recommendation to buy or sell any currency pair. Always test Fibonacci strategies on demo accounts before deploying live capital. Some links may be affiliate links.
[/coi_disclosure]
Volity operates a trading platform and also publishes educational and analytical content about trading. The content on this page is for educational purposes only and should not be considered financial advice. Volity may benefit commercially when readers open trading accounts through links on this site.
Our content is produced and reviewed under documented editorial standards; comparison and review methodology is published here.