Quick answer
A Japanese candlestick cheat sheet is a quick-reference guide to the main candlestick patterns and what they signal, grouped into bullish, bearish and continuation patterns like doji, hammer, engulfing and morning star. It helps traders spot reversals and momentum at a glance. Patterns work best with confirmation and context, not in isolation.
Investing in financial products involves risk. Losses may exceed the value of your original investment.
Every Forex move leaves a footprint. Japanese candlesticks capture that trace, open, high, low, and close, mapped into patterns that traders can read and win.
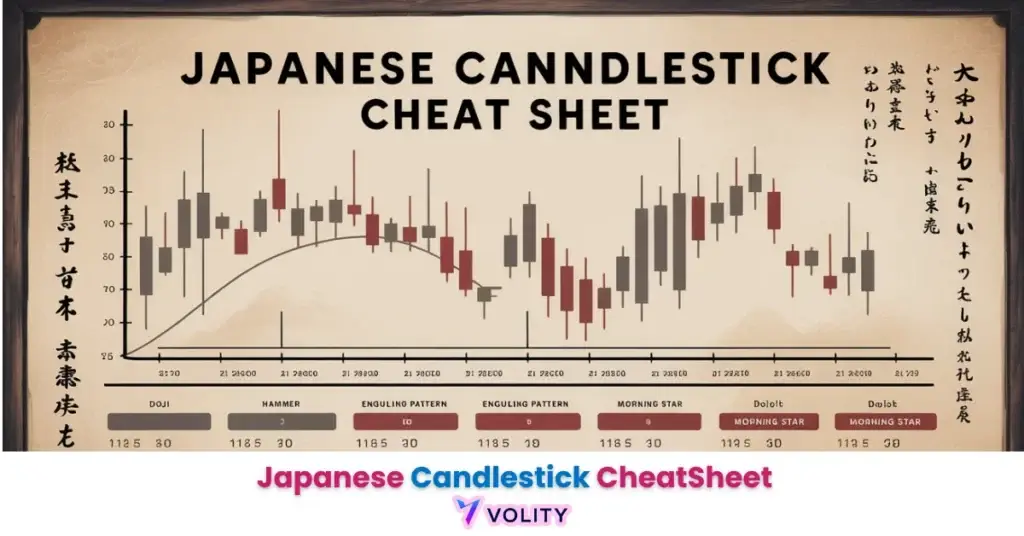
So we have created a quick-reference cheat sheet for trading Japanese Candlesticks. It brings together the most reliable candlestick patterns with clear direction, structure, and trading signals. You’ll see which candles hint at reversals, which ones continue trends, and how to recognise them on real charts.
While understanding Japanese Candlestick Cheat Sheet is important, applying that knowledge is where the real growth happens. Create Your Free Forex Trading Account to practice with a free demo account and put your strategy to the test.
What Is a Japanese Candlestick Pattern?
A Japanese candlestick is a special type of price chart used in forex and stock trading. It shows how much the price moved in a specific time period. whether one minute, one hour, or one day. Each candlestick gives four details: opening price, closing price, highest price, and lowest price.
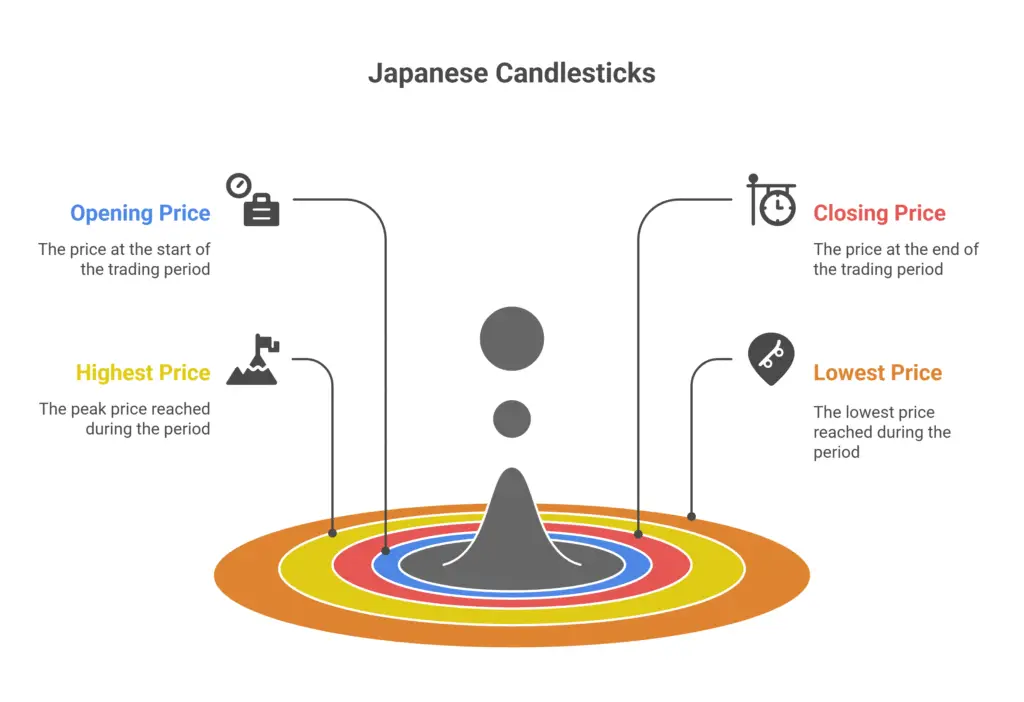
Unlike simple bar or line charts, Japanese candlesticks show this price movement in a visual block format. The body of the candle tells whether the price went up or down (bullish or bearish), and the wicks (shadows) show how high or low the price reached before settling.
Candlestick patterns come in two parts:
- Single Candlestick Patterns like Doji, Hammer, and Marubozu
- Multiple Candlestick Patterns, which can be dual (like Engulfing or Tweezer Tops) or triple (like Morning Star or Three White Soldiers)
Each pattern gives insight into market psychology. whether buyers are in control, sellers are weakening, or a reversal might occur. For example:
- A Doji shows indecision
- A Marubozu shows full control by buyers or sellers
- A Bullish Engulfing hints at a shift from bearish to bullish sentiment
Japanese candlesticks are different from simple candlesticks found in basic charting. What makes them “Japanese” is their structured visual form and the deep pattern recognition system developed by Japanese rice traders centuries ago. All these patterns still guide modern traders in making real-time decisions.
Ready to Elevate Your Trading?
You have the information. Now, get the platform. Join thousands of successful traders who use Volity for its powerful tools, fast execution, and dedicated support.
Create Your Account in Under 3 MinutesWhat is a Japanese Candlestick Cheat Sheet and Why Use it?
A candlestick cheat sheet is a quick-reference summary of common Japanese candlestick patterns, grouped by their directional bias. bullish or bearish. It helps traders instantly recognise what a pattern looks like, what it signals, and how to act on it. Unlike long-form explanations, a cheat sheet condenses key traits into one grid:
- Number of candlesticks
- Direction (bullish or bearish)
- Type (reversal or continuation)
- Typical structure
Now, why use it?
Let’s say the market climbs sharply. A candle appears with a long upper wick and a small body near the bottom. You’re unsure if it’s a signal or just noise. One look at your cheat sheet. it matches a Shooting Star. That’s a bearish reversal signal, often seen after uptrends. You hold back from buying and wait. The next candle confirms with a drop. The cheat sheet just helped you avoid a trap.
It’s also possible that price stalls after a downtrend at some other point in time. A long green candle appears with no wicks. a Bullish Marubozu. You check the cheat sheet again. It says buyers are fully in control. A reversal might begin. You plan your long entry with more clarity.
So, that’s how a cheat sheet ensures that every glance at the chart becomes faster, sharper, and more informed. In fact, professional traders often keep it alongside their routine checklist to make sure technical signals fit into a structured daily workflow.
The Ultimate Japanese Candlestick Cheat Sheet
We have compiled this cheat sheet as a practical, reference-backed summary of all key Japanese candlestick patterns. It breaks down each signal by structure, direction, and purpose, so you can recognize bullish or bearish intent at a glance.
Single Candlestick Patterns
| Pattern Name | No. of Candles | Direction | Structure | Action |
| Hammer | 1 | Bullish | Small body, long lower wick | Reversal at bottom of downtrend |
| Inverse Hammer | 1 | Bullish | Small body, long upper wick | Reversal clue after a decline |
| Hanging Man | 1 | Bearish | Small body, long lower wick | Warning at top of uptrend |
| Shooting Star | 1 | Bearish | Small body, long upper wick | Reversal clue at top |
| Doji | 1 | Neutral | Open = Close | Indecision, potential reversal |
| Spinning Top | 1 | Neutral | Small body, long wicks both ends | Indecision, weakening momentum |
| Bullish Marubozu | 1 | Bullish | Full green body, no wicks | Strong upward continuation |
| Bearish Marubozu | 1 | Bearish | Full red body, no wicks | Strong downward continuation |
Double Candlestick Patterns
| Pattern Name | No. of Candles | Direction | Structure | Action |
| Bullish Engulfing | 2 | Bullish | Red candle engulfed by large green | Reversal at bottom |
| Bearish Engulfing | 2 | Bearish | Green candle engulfed by large red | Reversal at top |
| Piercing Line | 2 | Bullish | Long red, then green opens lower, closes high | Bullish reversal with gap |
| Dark Cloud Cover | 2 | Bearish | Green followed by red piercing more than 50% | Bearish reversal warning |
| Tweezer Bottoms | 2 | Bullish | Identical lows, red then green | Double test of support |
| Tweezer Tops | 2 | Bearish | Identical highs, green then red | Double test of resistance |
| Bullish Harami | 2 | Bullish | Large red followed by small green inside it | Reversal or continuation |
| Bearish Harami | 2 | Bearish | Large green followed by small red inside it | Reversal or continuation |
Triple Candlestick Patterns
| Pattern Name | No. of Candles | Direction | Structure | Action |
| Morning Star | 3 | Bullish | Long red → small body → long green | Strong reversal after a decline |
| Evening Star | 3 | Bearish | Long green → small body → long red | Strong reversal after a rally |
| Three White Soldiers | 3 | Bullish | Three strong green candles, each closing higher | Reversal and start of uptrend |
| Three Black Crows | 3 | Bearish | Three strong red candles, each closing lower | Reversal and start of downtrend |
| Rising Three Methods | 5 | Bullish | Green → 3 small reds → large green | Continuation of uptrend |
| Falling Three Methods | 5 | Bearish | Red → 3 small greens → large red | Continuation of downtrend |
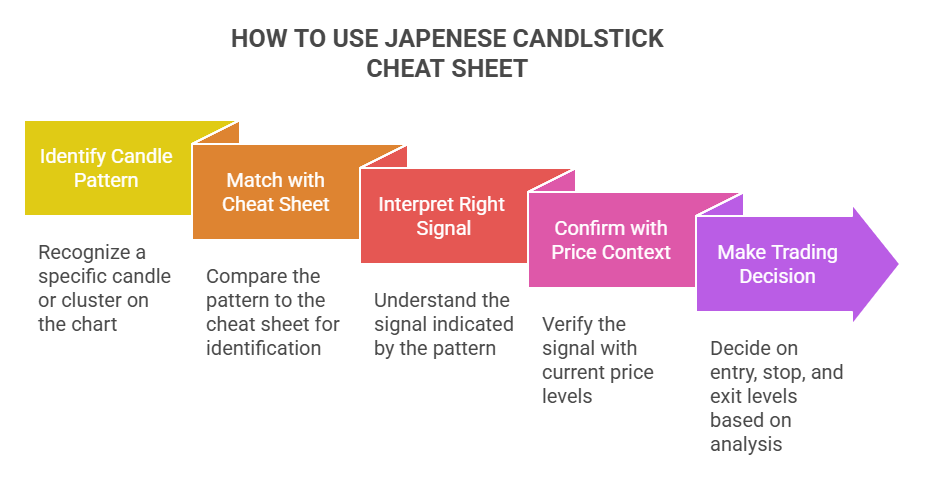
How to Use the Japanese Candlestick Cheat Sheet?
The cheat sheet works like your pattern recognition guide. Keep it next to your trading screen. Every time a candle or cluster catches your eye, match it against the visual on the sheet. See what it signals. Then confirm with price context.
Let’s break it down with examples:
- During a strong rally, a small-bodied candle with long wicks appears. You check the cheat sheet. It matches a Spinning Top. a sign of indecision. You don’t rush. You wait for the next move before entering.
- After a sharp fall, a candle forms with equal open and close and long shadows. a Doji. The cheat sheet reminds you it signals exhaustion. You combine it with support levels. A bounce follows. You act with more confidence.
- At resistance, a Bearish Engulfing appears. a big red candle swallows the previous green one. The cheat sheet confirms it’s a reversal signal. You prepare your short plan.
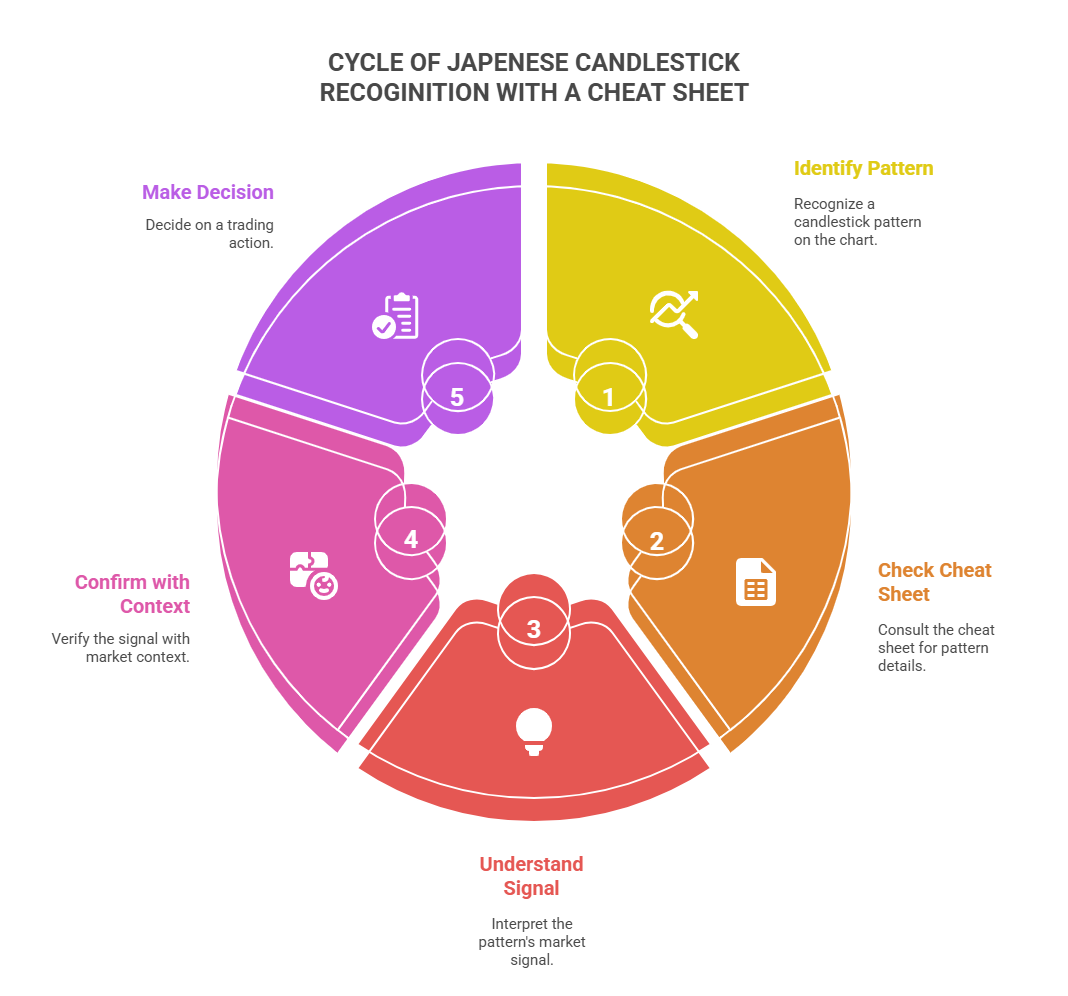
You can use the Japanese candlestick cheat sheet to:
- Identify the pattern fast
- Understand if it’s bullish, bearish, or neutral
- Combine with volume, support/resistance, or trend lines
- Decide your entry, stop, and exit levels
Over time, patterns get memorized. But until then, the cheat sheet speeds up your learning and sharpens your decisions.
Turn Knowledge into Profit
You have done the reading, now it is time to act. The best way to learn is by doing. Open a free, no-risk demo account and practice your strategy with virtual funds today.
Open a Free Demo AccountFinal Words
It is not enough to simply memorise candlestick names or shapes. You must understand where and why they appear. So make sure that each pattern you read links to trends, support zones, or volume shifts. A cheat sheet helps you recall. But real trades depend on placement.
A Doji near resistance means something. A Hammer after a sell-off shows pressure. Without context, even a perfect pattern misleads. So keep the cheat sheet close, but always match each signal with real market logic before acting.
FAQs
Related guides
Volity operates a trading platform and also publishes educational and analytical content about trading. The content on this page is for educational purposes only and should not be considered financial advice. Volity may benefit commercially when readers open trading accounts through links on this site.
Our content is produced and reviewed under documented editorial standards; comparison and review methodology is published here.