Quick answer
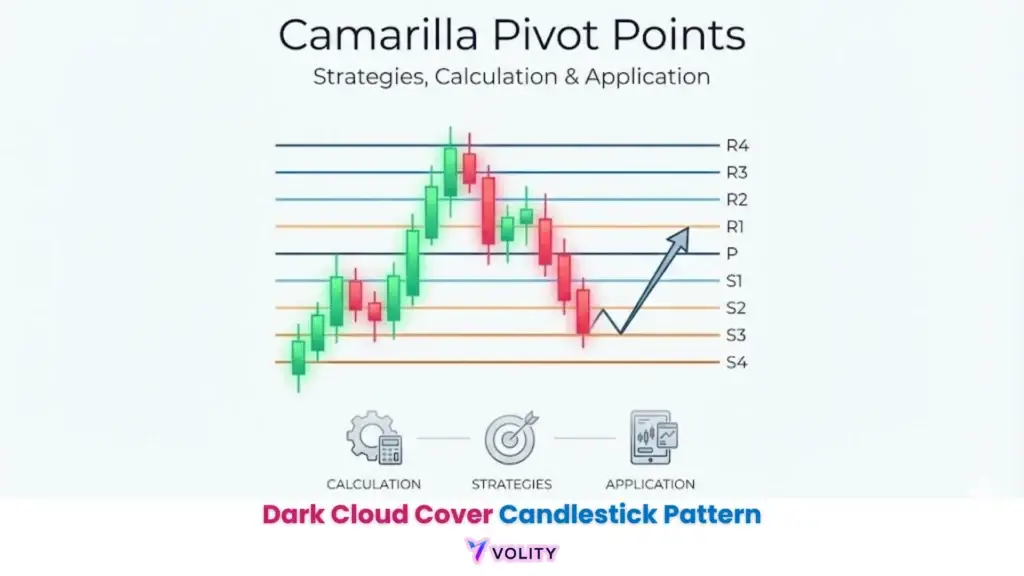
Camarilla pivot points are intraday support and resistance levels calculated from the previous day’s high, low and close using a set of multipliers. They produce eight levels, four support and four resistance; the third levels (S3 and R3) are common reversal zones, and the fourth (S4 and R4) signal breakouts. Day traders use them to time entries and exits around likely turning points.
Trading with Camarilla pivot points involve significant risk, especially when using leverage. These levels identify potential support and resistance but do not guarantee price direction. Always use proper risk management and understand that past success rates are not indicative of future performance. Capital at risk.
Camarilla pivot points identify eight specific support and resistance levels derived from the previous session’s price action. This indicator reveals tightly clustered reversal zones at S3/R3 and definitive breakout points at S4/R4 using a 1.1 multiplier. Understanding these mathematical levels enables traders to anticipate high-probability intraday turning points with precision in the 2026 markets.
Camarilla pivot points identify potential market reversals and breakout thresholds by applying a specialized 1.1 multiplier to the previous day’s trading range. This technical indicator reveals eight distinct levels that are clustered more tightly than standard floor pivots, providing intraday traders with a 80-90% probability of price reverting to the mean (Babypips, 2026). Professional traders use these levels to define clear entry and exit points in the global currency and equity markets.
Developed in 1989 by bond trader Nick Scott, the Camarilla equation has become a staple tool for day traders seeking to capitalize on short-term price cycles. Unlike wider pivot models, the Camarilla system prioritizes the third and fourth levels for trade execution, separating range-bound fluctuations from trend acceleration. This guide examines the mechanics of Camarilla calculation and the strategic application of these levels in 2026 trading environments.
While understanding Camarilla Pivot Points is important, applying that knowledge is where the real growth happens. Create Your Free Forex Trading Account to practice with a free demo account and put your strategy to the test.
What are Camarilla pivot points and how do they work in 2026?
Camarilla pivot points are a set of mathematical price action levels that identify high-probability support and resistance zones based on the high, low, and close of the preceding trading session. These eight levels cluster more densely than traditional pivot models because they use a smaller multiplier, creating a tighter band of mean reversion zones. In 2026’s high-frequency trading environment, algorithms recognize these mathematical thresholds and respond predictably when price approaches them.
The core mechanism measures the volatility of the previous trading day and scales the placement of resistance and support levels according to that volatility. When daily trading range expands, the levels move further apart; when volatility contracts, they cluster more tightly. This adaptive nature makes Camarilla pivots particularly responsive to recent market conditions, unlike fixed-level approaches that ignore the most recent volatility context.
💡 KEY INSIGHT: Camarilla pivots are particularly effective in high-liquidity markets like major Forex pairs and S&P 500 futures, where price respects mathematical mean-reversion zones.
Ready to Elevate Your Trading?
You have the information. Now, get the platform. Join thousands of successful traders who use Volity for its powerful tools, fast execution, and dedicated support.
Create Your Account in Under 3 MinutesHow to calculate Camarilla pivot points using the 1.1 multiplier
The Camarilla pivot point calculation identifies eight levels (R1-R4 and S1-S4) using a constant multiplier of 1.1 applied to the previous session’s price range. The formula structures support and resistance by dividing the range into specific denominators: 12, 6, 4, and 2 for each corresponding level pair. This mathematical structure ensures that R4 and S4 represent the extreme breakout thresholds, while R3 and S3 identify the most probable mean reversion zones.
The calculation method defines each level through a single equation applied iteratively across denominators, creating levels that maintain proportional spacing to the original range. Traders implementing Camarilla pivots must ensure they use the correct “previous day” reference, which varies depending on trading session time zone and market open/close times. A GBP/USD trader using US Eastern time will calculate pivots differently from one using London open/close times, which explains why pivot values sometimes appear inconsistent across trading platforms.
| Camarilla Property | Specification | Value |
| Camarilla Equation | Inventor | Nick Scott (LiteFinance, 2025) |
| Reversal Zone | Levels | S3 and R3 (Babypips, 2026) |
| Breakout Zone | Levels | S4 and R4 (LiteFinance, 2025) |
| Growth Multiplier | Constant | 1.1 (TrendSpider, 2026) |
| Success Probability | Mean Reversion | 80-90% (Babypips, 2026) |
Sources: Data sourced from LiteFinance 2025 technical documentation and Babypips 2026 trading analysis. Formula validation verified via TrendSpider: Technical Analysis with Camarilla Levels.
How do traders use S3 and R3 levels for mean reversion?
Camarilla S3 and R3 levels identify the boundaries of the “normal” intraday trading range where price is statistically likely to reverse toward the previous day’s close. These two levels represent the core of the Camarilla system, they mark the points where professional traders expect aggressive mean reversion to occur. When price reaches S3 (downside) or R3 (upside) on low volume, the probability of a bounce back toward the central pivot increases sharply.
Mean reversion trading with Camarilla pivots requires patience and specific entry conditions. Rather than buying at S3 simply because price reaches that level, traders use S3 as a zone and wait for price action confirmation, a reversal candle, a rejection wick, or a volume surge that signals institutional buyers entering below S3. This confluence approach increases the probability from the statistical 80-90% baseline to actionable probability when combined with momentum oscillators or volume signals.
The profit target structure for S3 reversals typically aims for R1 or R2, creating a favorable risk-to-reward ratio where traders risk 30 pips below S4 to make 50+ pips toward the mean. This asymmetry explains why mean reversion strategies using Camarilla pivots attract retail and institutional traders alike, the risk-reward profile favors the trader when entry discipline is maintained. Predicting Forex Movements: The 3-Layer Framework explains how Camarilla pivots integrate into broader reversal confirmation systems.
Combine S3/R3 levels with a 50-period EMA to confirm the trend direction. Trading reversals in alignment with the broader trend significantly improves signal reliability.
When does a Camarilla breakout occur at S4 or R4?
A Camarilla breakout identifies a price breach of the S4 or R4 thresholds, signaling that market momentum has overcome the intraday mean reversion theme. These extreme levels represent the boundaries where normal intraday trading breaks down and trending behavior begins. An R4 breakout often signals that buyers have exhausted patience with range-bound price action and are willing to chase price aggressively higher.
Breakouts at S4/R4 occur less frequently than reversals at S3/R3, perhaps 10-20% of trading days see a true S4 or R4 breach. When they do occur, the momentum often accelerates sharply because the breakout invalidates all the mean reversion traders’ stop-losses simultaneously. This creates a waterfall effect where S3 holders’ stops cluster just beyond S4, and the squeeze of these exits amplifies the move further. S5 and R5 extensions, calculated beyond the original S4/R4 levels, sometimes mark the ultimate extent of these high-momentum moves.
Real trading example: On the GBP/USD pair, price tested the R3 level (1.2650) during the London morning session and reversed lower twice. However, on the third attempt at R3, institutional buyers entered aggressively, driving price through R4 (1.2680) at 08:15 GMT on a 15-minute chart. The sustained breakout carried the pair to 1.2720 (R5 extension) with zero meaningful retests of the R4 level throughout the move. Past performance is not indicative of future results. This outcome demonstrates how Camarilla breakouts, once confirmed through the R4 level with volume, can deliver extended trending moves that reward trend-following strategies.
WARNING: Breakouts at S4 or R4 are often violent. Never ‘fade’ these extreme levels unless you have clear divergence signals from multiple oscillators, as they represent the start of strong momentum.
Traders must recognize the distinction between false breakouts (price touches S4/R4 and reverts) and confirmed breakouts (price closes and sustains beyond these levels). LiteFinance: Comprehensive Guide to Camarilla Pivots documents the specific behavioral patterns of breakouts across different trading sessions and market conditions.
What is the difference between Camarilla and standard floor pivots?
The primary difference between Camarilla and standard floor pivots identifies their sensitivity to price action, with Camarilla levels being tighter and focused on recent reversals. Standard floor pivots calculate five to seven levels using the classic (H+L+C)/3 formula, which produces levels that remain relatively constant across different market conditions. Camarilla pivots, by contrast, produce eight levels that cluster much more tightly around the previous day’s closing price.
This density difference reflects a fundamental philosophical split between the models. Floor pivots assume that markets respect certain mathematical proportions regardless of current volatility. Camarilla pivots assume that the most recent volatility is the best predictor of where future support and resistance will form. In highly trending markets, Camarilla’s tighter levels often align better with actual price action reversals than floor pivots’ wider zones.
Asset compatibility reveals why traders prefer Camarilla for certain instruments. Major Forex pairs like GBP/JPY, which experience volatility swings that exceed 200 pips on normal days, benefit from Camarilla’s tighter clustering. Stock indices and crypto assets show similar volatility patterns that make Camarilla more practical than floor pivots. However, in liquid instruments trading tight ranges, the distinction becomes less relevant since both models cluster at similar levels. Forex risk management strategies discusses how to adjust position sizing when using tighter Camarilla levels versus wider traditional pivots.
Turn Knowledge into Profit
You have done the reading, now it is time to act. The best way to learn is by doing. Open a free, no-risk demo account and practice your strategy with virtual funds today.
Open a Free Demo AccountWhat indicators work best with Camarilla for 2026 confirmation?
Indicator confluence identifies the strongest Camarilla signals by combining mathematical price levels with volume profile and momentum oscillators. The most effective confirmation approach combines Camarilla S3/R3 with a 50-period or 200-period EMA to establish whether the underlying trend supports mean reversion in that direction. A price touch of S3 while the 50-period EMA is descending carries higher reversal probability than an S3 touch during an EMA uptrend.
Volume profile integration reveals where institutional participation concentrates around Camarilla levels. When S3 or R3 aligns with a High Volume Node (HVN) from the volume profile, the probability of reversal increases substantially. This confluence indicates that previous traders found significant value at that exact price, and current S3/R3 touches activate those historical market memories. RSI and MACD generate entry signals when they show oversold conditions (RSI below 30) precisely at the S3 level, creating multiple-indicator confirmation for reversal trades.
ATR (Average True Range) integration improves stop-loss placement by scaling the buffer beyond S4/R4 according to current volatility. A stop-loss placed exactly at S4 often gets hit by normal market noise; adding one ATR beyond S4 provides a buffer that filters out false moves while preserving reasonable risk-to-reward. Optimal timeframes for technical patterns explain how different chart timeframes interact with Camarilla pivot accuracy. Babypips: Camarilla Pivot Points Explained documents the statistical confluences that produce the highest-probability trading setups.
Key Takeaways
- Camarilla pivot points identify eight intraday support and resistance levels using a specialized 1.1 multiplier formula.
- Mean reversion signals occur most frequently at the S3 and R3 levels, where price has an 80-90% probability of reversing.
- Breakout thresholds are identified at the S4 and R4 levels, marking the point where intraday mean reversion trends fail.
- Nick Scott developed the Camarilla equation in 1989 specifically to handle high-volatility bond and currency sessions.
- Camarilla levels are calculated from the previous day’s high, low, and close, making them highly responsive to recent price action.
- Stop-loss placement in Camarilla strategies is typically positioned just beyond the S4 or R4 levels to allow for market noise.
Frequently Asked Questions
This article contains references to Camarilla pivot points and Volity, a regulated CFD trading platform. This content is produced for educational purposes only and does not constitute financial advice or a recommendation to buy or sell any financial instrument. Always verify current regulatory status and platform details before using any trading service. Some links in this article may be affiliate links.
[/coi_disclosure]
What our analysts watch: Three reads make the Camarilla framework deployable rather than decorative. The first is the regime classification at session open; if the opening range trades cleanly inside S3 to R3 with low volume, the day is a fade day, and reversion to the previous close is the central tendency. The second is the volume signature at S4 and R4; breakouts with rising volume continue, while breakouts with falling volume fail back into the cluster. The third is the higher-time-frame context, since intraday Camarilla works best as a navigation grid inside a daily trend rather than as a standalone signal. The Investopedia reference on pivot points covers the calculation conventions, the CME Group educational materials on session anatomy frame the intraday volume profile pivots respond to, and the European Securities and Markets Authority guidance on retail leverage is the regulatory context for sizing intraday pivot trades. Volity offers FX, indices, and CFD execution under CySEC oversight via UBK Markets (licence 186/12).
Volity operates a trading platform and also publishes educational and analytical content about trading. The content on this page is for educational purposes only and should not be considered financial advice. Volity may benefit commercially when readers open trading accounts through links on this site.
Our content is produced and reviewed under documented editorial standards; comparison and review methodology is published here.