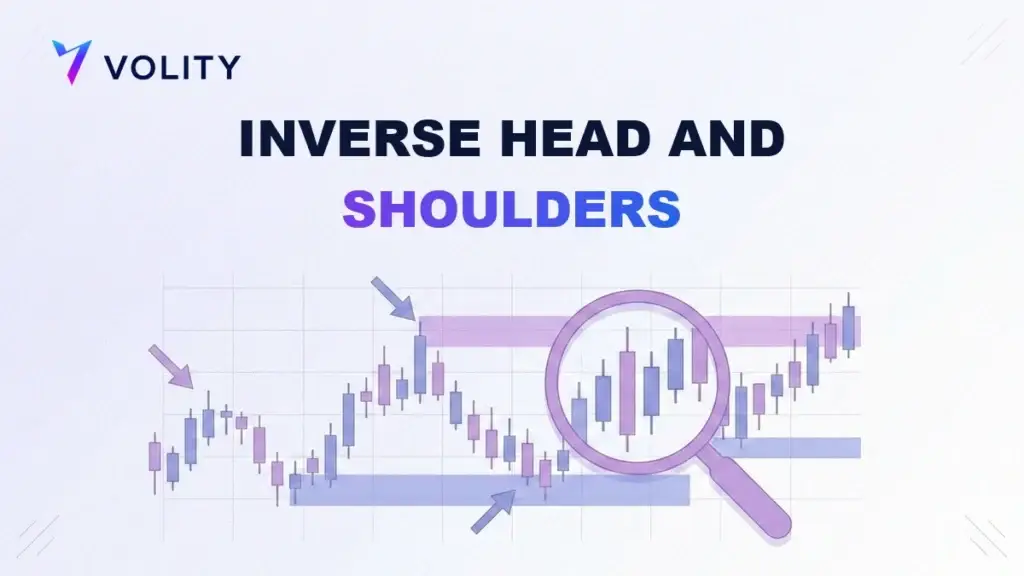
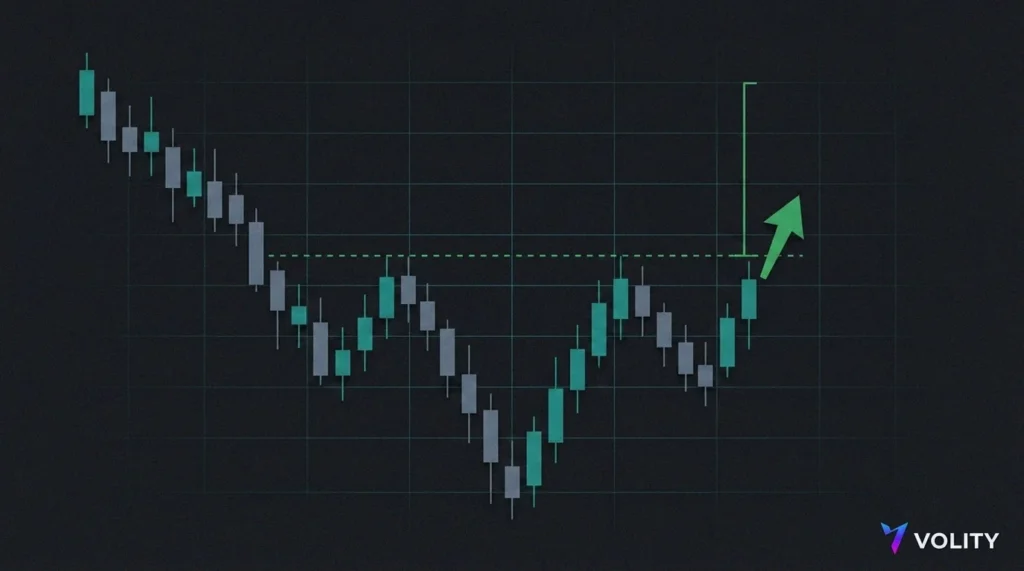
The inverse head and shoulders is a bullish reversal pattern that forms at the bottom of a downtrend. It has three troughs: a lower low in the middle (the head) flanked by two shallower lows (the shoulders). The pattern confirms when price breaks above the neckline, the line drawn across the two peaks between the troughs.
What is an inverse head and shoulders pattern?
The inverse head and shoulders pattern is the upside-down version of the classic head and shoulders. Instead of three peaks at a market top, it is three troughs at a market bottom. Reading left to right, it forms in a clear sequence.
- The left shoulder is the first low, where price drops and then bounces.
- The head is a deeper low, the lowest point of the whole pattern, before price bounces again.
- The right shoulder is a third low that holds above the head, roughly level with the left shoulder, a sign that sellers are running out of force.
The two rally peaks between these troughs define the neckline. It can be horizontal or gently sloped, effectively a short trend line connecting the two highs, and it is the trigger for the whole pattern. Nothing is confirmed until price closes above it.
What does the inverse head and shoulders signal?
The pattern traces the exhaustion of a downtrend. The head marks a final push to a new low that fails to hold. When the next decline stops short at the right shoulder, well above the head, it shows sellers can no longer force fresh lows. Buyers are steadily taking control. The break above the neckline is the moment that shift becomes visible, as demand overwhelms the supply that had been capping every bounce.
Symmetry adds confidence. The cleanest inverse head and shoulders patterns have two shoulders at similar lows and similar widths, with the head clearly deeper than both. A lopsided version still works, but a balanced one is easier to trade and tends to attract more market participants, which can help the breakout follow through.
How do you trade the inverse head and shoulders?
A repeatable routine settles the entry and the risk before the trade goes on.
- Confirm the structure. Check for a prior downtrend and three clear troughs, with the head lower than both shoulders and the shoulders roughly level.
- Draw the neckline across the two peaks between the troughs. That line is your breakout trigger.
- Enter when price closes above the neckline. A close, rather than a brief spike through it, filters out many false breaks.
- Use the retest if it comes. Price often pulls back to the neckline after breaking out, and a successful retest, where the old neckline holds as support, offers a lower-risk entry.
- Set a protective stop below the right shoulder. For the target, measure the distance from the head up to the neckline and project it upward from the breakout point.
Volume is a useful tell. Ideally it is lighter on the head and heavier on the neckline breakout, which points to genuine buying interest behind the reversal rather than a low-conviction drift higher. Reading volume that way is standard breakout analysis.
Inverse vs standard head and shoulders: what is the difference?
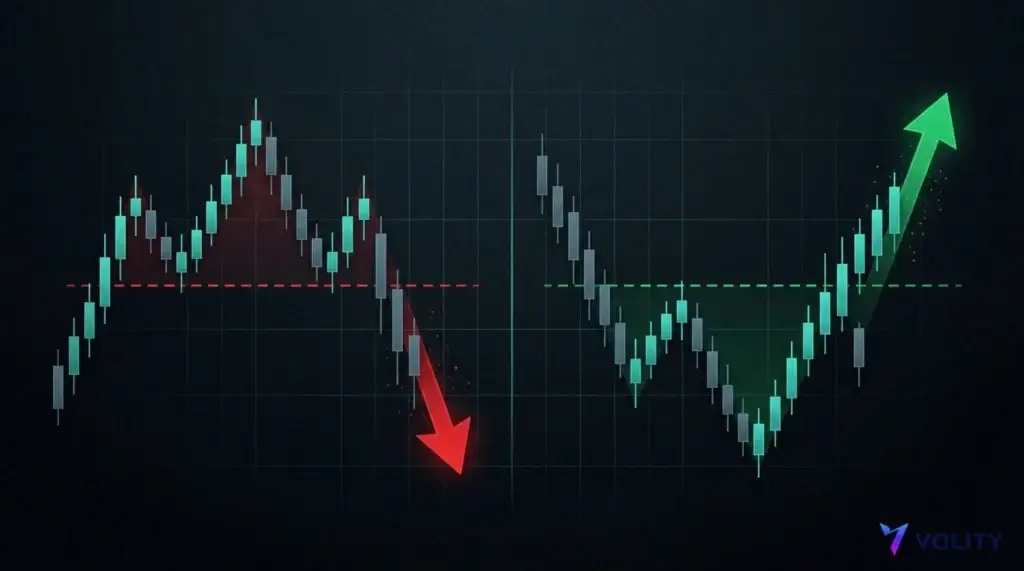
The standard head and shoulders pattern is the bearish mirror of the inverse. It is the same anatomy flipped vertically, and it gives the opposite signal. This table sets them side by side.
| Feature | Inverse head and shoulders | Standard head and shoulders |
| Forms after | A downtrend | An uptrend |
| Built from | Three troughs | Three peaks |
| Head is the | Lowest low | Highest high |
| Neckline break | Upward | Downward |
| Signal | Bullish reversal | Bearish reversal |
If you can read one, you can read the other. The standard version signals a top when price breaks below the neckline; the inverse signals a bottom when price breaks above it. The measured-move target is calculated the same way in both, just projected in the opposite direction. That measured move is a well-documented target method for the pattern.
Is an “inverted head and shoulder pattern” the same thing?
Yes. An inverted head and shoulder pattern, an inverse head and shoulders, and a reverse head and shoulders all describe the same bullish bottoming formation. The terms are used interchangeably. Whether a chart or a trader says inverse or inverted, they mean the three-trough pattern that reverses a downtrend on a break above the neckline.
The only thing to watch is not confusing it with the standard head and shoulders at a market top, which is bearish. Check whether you are looking at three troughs at a low or three peaks at a high, and the direction of the signal is clear. Related reversal patterns such as the double top and double bottom turn on the same read of exhausted momentum.
What are the limitations of the inverse head and shoulders?
The biggest risk is jumping in before the neckline breaks. Three troughs are not a valid chart pattern until price confirms above the neckline, and traders who anticipate the break are often caught when the right shoulder fails and price makes a new low instead. False breakouts are the other hazard, where price nudges above the neckline, cannot hold, and reverses. The pattern can also take many weeks to form, and a partly built formation can dissolve at any time.
Wait for a confirmed close above the neckline, favour breakouts backed by rising volume, and use the retest when it is offered. On leveraged products such as CFDs, a false break can move against you quickly, so a stop below the right shoulder and a fixed risk-per-trade are essential. The pattern hands you defined levels; your risk plan keeps a failed break small.
How can you trade inverse head and shoulders setups on Volity?
Volity is an all-in-one money hub, with your wallet, payments, and trading in one account. The charting in Volity MT lets you draw the neckline, project a measured-move target, and watch for the breakout across more than 40 forex pairs, global indices, commodities, and crypto. Attach a stop-loss and take-profit at entry so the whole trade is planned before the neckline gives way.
Reversal patterns reward traders who can act in either direction, which is where CFD trading fits, letting you trade the inverse head and shoulders long and the standard version short. Leverage runs up to 1:500 on selected forex pairs and is product-dependent, with lower limits on higher-volatility markets, margin shown before every order, and negative balance protection in place. Execution is regulated by CySEC under UBK Markets, licence 186/12. You can open an account for $0 and rehearse the setup on a demo before committing real capital, then check the full cost picture on the charges and fees page.
CFDs are leveraged products, and most retail accounts lose money trading them, which is why regulators such as ESMA and CySEC set strict rules on how they are marketed. Pair the pattern with sound technical analysis and firm risk limits. An inverse head and shoulders helps you define your risk. It does not remove it.
Inverse head and shoulders FAQ
Is the inverse head and shoulders bullish or bearish?
The inverse head and shoulders is bullish. It forms at the bottom of a downtrend and signals a reversal to the upside when price breaks above the neckline. Its bearish counterpart, the standard head and shoulders, forms at the top of an uptrend and signals a reversal downward.
How do you set a target on an inverse head and shoulders pattern?
Measure the vertical distance from the head, the lowest trough, up to the neckline. Then project that same distance above the point where price breaks out through the neckline. That measured move is the standard first target. Many traders take partial profit there and trail the rest, since strong reversals can extend well beyond it.
How reliable is the inverse head and shoulders?
It is one of the more reliable reversal patterns when it is traded on a confirmed neckline break rather than in anticipation. Reliability improves with clean symmetry, a clearly deeper head, and a volume-backed breakout. As with any pattern in technical analysis it can still fail, so confirmation and a defined stop below the right shoulder remain essential.
What timeframe works best for the inverse head and shoulders?
The pattern appears on every timeframe, from intraday charts to weekly ones. Patterns that form over longer periods, such as the daily or weekly chart, tend to be more significant and to produce more durable reversals than those on very short intraday charts, where noise creates more false signals. On Volity MT you can scan any timeframe on one account.