The financial markets are not driven by data alone but by human psychology. The collective swings between optimism and fear create recognizable patterns that repeat over time. The Elliott Wave Theory, developed by Ralph Nelson Elliott in the 1930s, provides a framework for understanding these psychology-driven market cycles. It suggests that market movements are not random but follow a predictable, repetitive structure based on the natural rhythm of mass human behavior.
Key Takeaways
- Markets move in 5 impulse waves + 3 corrective waves.
- Three cardinal rules: Wave 2 never fully retraces Wave 1, Wave 3 is never the shortest, Wave 4 doesn’t overlap Wave 1.
- Wave 3 is the strongest and most profitable wave.
- Elliott Waves are fractal and work on all timeframes.
- Useful across markets: stocks (long-term), forex (swings), crypto (volatile rallies).
- Works best when combined with RSI, MACD, or other indicators.
- Limitations: subjective counts, weak in sideways markets, hindsight bias.
What is Elliott Wave Theory?
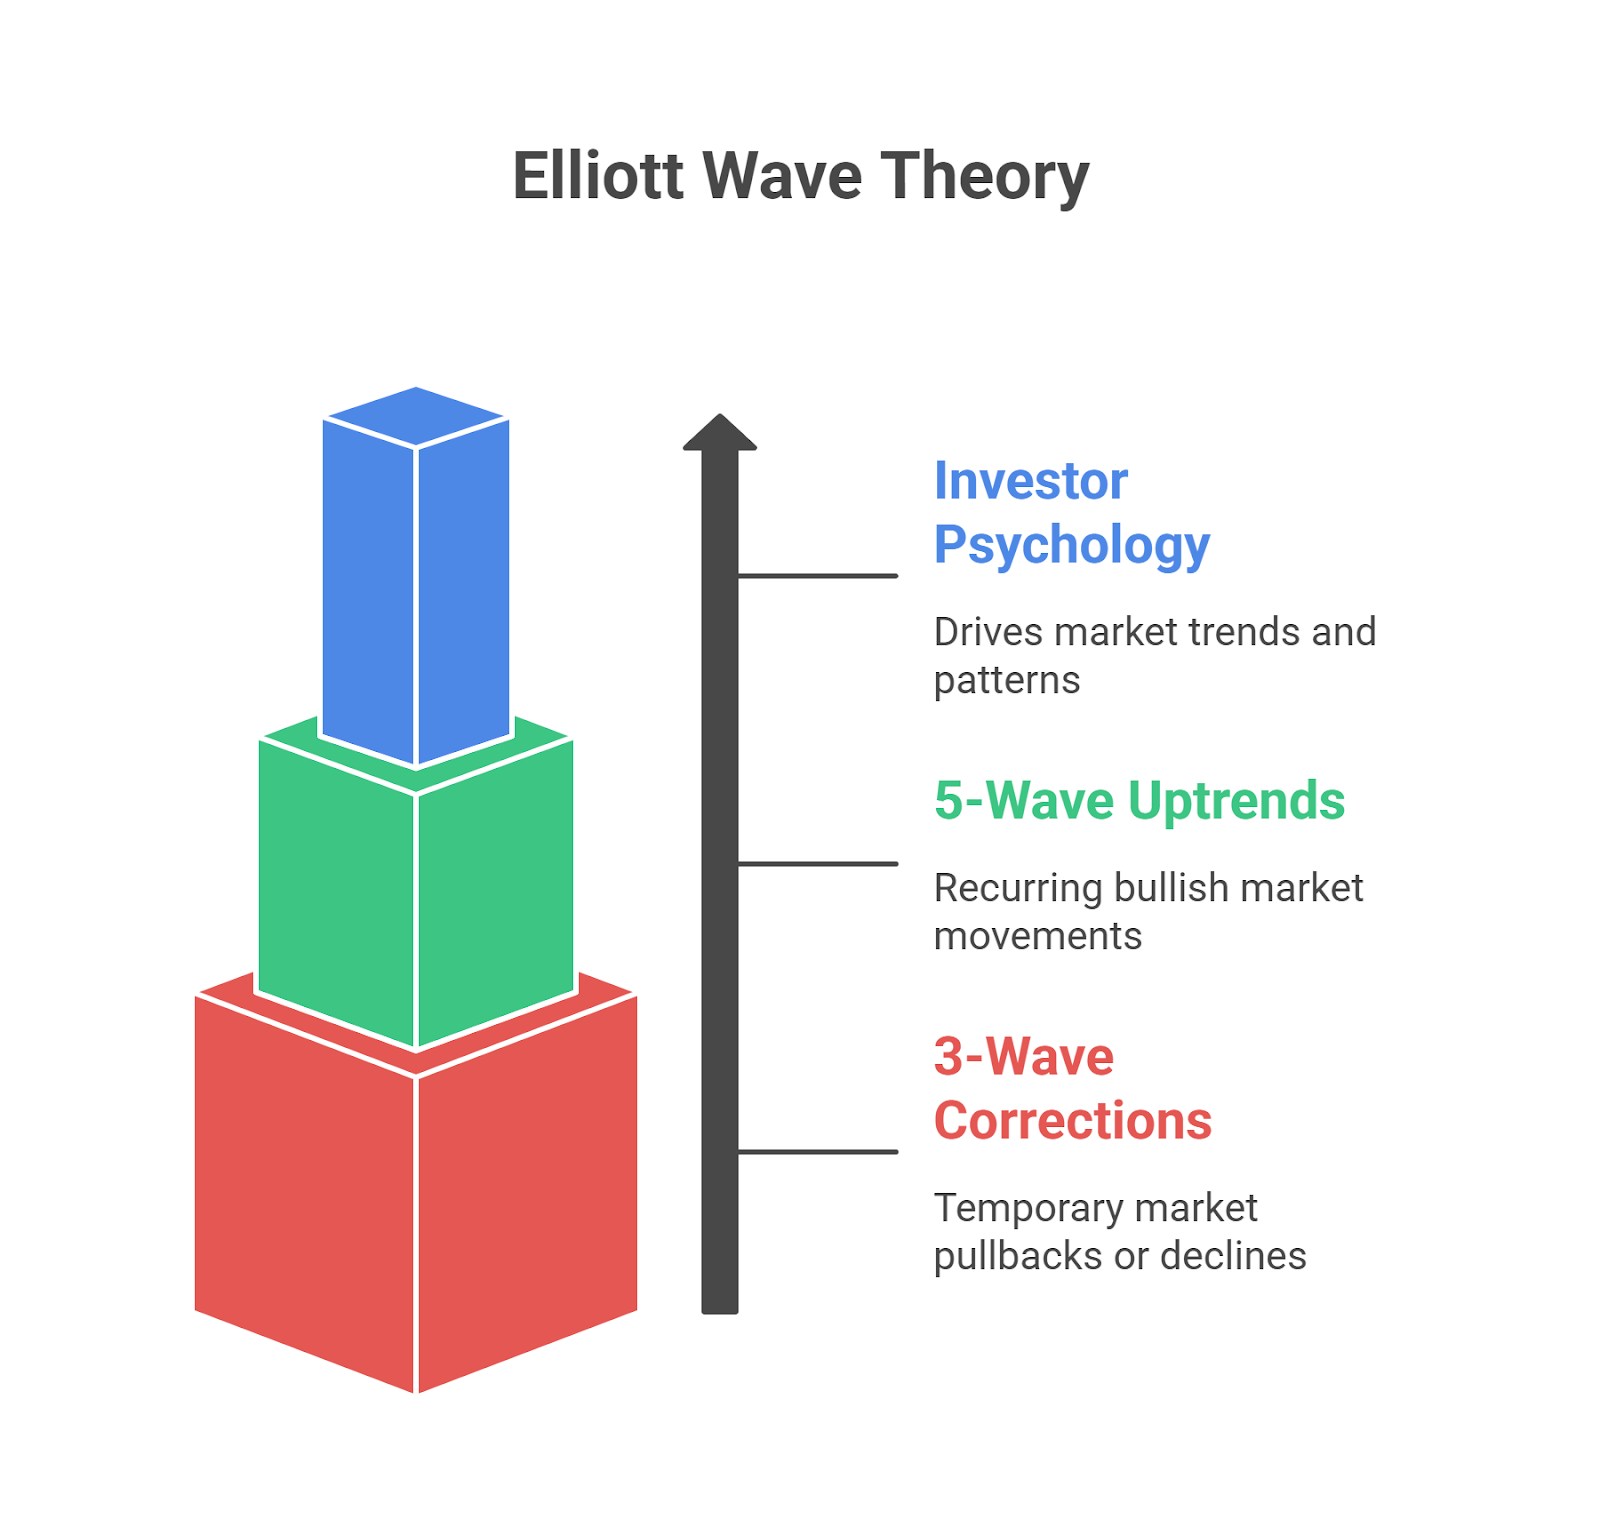
The Elliott Wave Theory is a method of market analysis based on recurring 5-wave uptrends and 3-wave corrections driven by investor psychology.

The theory’s core is the 5-3 pattern. This pattern consists of five impulse waves (labeled 1-5) that make up the main trend, followed by three corrective waves (labeled A-B-C) that move against it. A key principle of the theory is its fractal nature, meaning this 5-3 pattern appears on all timeframes, from long-term charts to short-term intraday charts.
Quick Elliott Wave Pattern Cheat Sheet
- Impulse Waves (1-2-3-4-5): The five-wave pattern that defines the primary market trend.
- Corrective Waves (A-B-C): The three-wave counter-trend pattern that follows the impulse sequence.
For a recent example, the Bitcoin (BTC/USD) daily chart has often displayed clear five-wave rallies, demonstrating how this pattern appears in modern, volatile markets.
Elliott Wave Rules (Core Foundation)
To correctly apply the Elliott Wave Theory, three cardinal rules must be followed. If any of these rules are broken, the wave count is considered invalid, and the analyst must re-evaluate the pattern.
- Rule 1: Wave 2 Cannot Retrace More Than 100% of Wave 1. This means the bottom of Wave 2 can never go below the starting point of Wave 1.
- Rule 2: Wave 3 Can Never Be the Shortest of the Three Impulse Waves (1, 3, and 5). Wave 3 is often the longest and most powerful wave in the sequence, reflecting the strongest part of the trend.
- Rule 3: Wave 4 Does Not Overlap with the Price Territory of Wave 1. The low of Wave 4 cannot drop into the range of Wave 1. This rule is firm in futures and stock markets but is sometimes relaxed for diagonals in spot forex and crypto markets.
Quick Rules of Elliott Wave Checklist
- Wave 2 > 0% of Wave 1
- Wave 3 ≠ Shortest Impulse Wave
- Wave 4 does not overlap Wave 1
Elliott Wave Patterns
The 5-3 structure is composed of two primary pattern types: impulse waves and corrective waves.
Impulse Waves
Impulse waves are the engine of the trend and consist of five sub-waves that move in the direction of the larger trend.
- Wave 1: Represents the initial push of a new trend.
- Wave 2: A corrective wave that retraces a portion of Wave 1.
- Wave 3: This is typically the longest and most powerful wave, often showing an extension where its sub-waves are elongated.
- Wave 4: Another corrective wave, which is often shallow and complex.
- Wave 5: The final impulse wave, which can sometimes result in a truncation (falling short of the Wave 3 high) or form a diagonal pattern signaling exhaustion.
Corrective Waves
Corrective waves move against the primary trend and are more complex. They adhere to the alternation principle, which suggests that if Wave 2 is a sharp correction, Wave 4 will likely be a sideways one, and vice-versa.
Corrective Patterns
| Pattern | Structure | Description |
| Zigzag (5-3-5) | A-B-C | A sharp, fast correction that moves steeply against the primary trend. |
| Flat (3-3-5) | A-B-C | A sideways correction where waves A, B, and C are of similar length. |
| Triangle (3-3-3-3-3) | A-B-C-D-E | A consolidating pattern with converging trendlines, indicating a pause. |
Which Elliott Wave is the Strongest?
Wave 3 is unequivocally the strongest and most powerful wave in an Elliott Wave sequence. It is the part of the trend where the momentum is highest, participation is broadest, and price movement is most significant. For traders, correctly identifying and capturing Wave 3 is often the primary goal of using this theory.
Key characteristics of Wave 3 include:
- High Volume: Trading volume typically expands significantly during Wave 3.
- Strong Momentum: Indicators like the RSI and MACD will show strong momentum in the direction of the trend.
- Fibonacci Extensions: Wave 3 often extends to 1.618 or even 2.618 times the length of Wave 1.
Because it offers the greatest potential for profit with a clear trend, many trading strategies are built exclusively around entering after Wave 2 completes and riding Wave 3.
How to Identify Elliott Waves on Charts
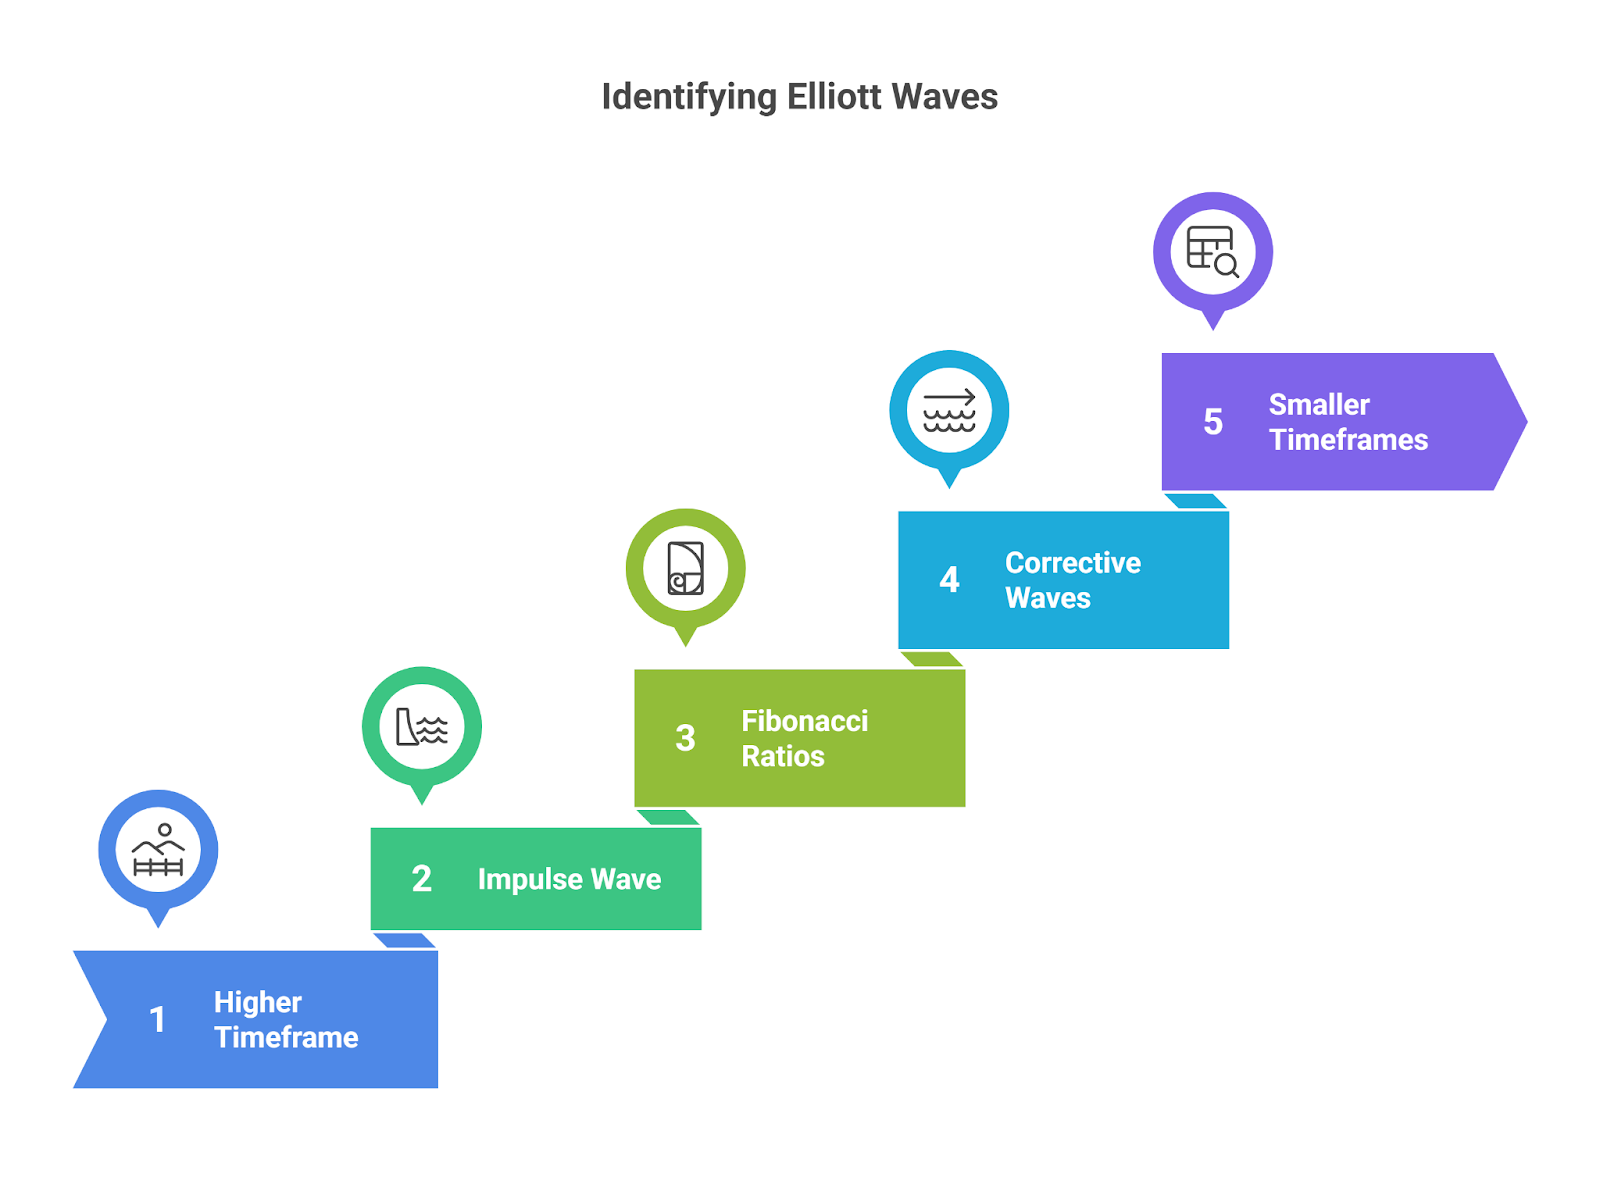
Identifying Elliott Waves requires practice and a systematic approach. Following a step-by-step process can help increase accuracy.

- Start on a Higher Timeframe: Begin your analysis on a daily or weekly chart to identify the primary, long-term trend.
- Look for an Obvious Impulse Wave: Find a clear, strong, five-wave move.
- Apply Fibonacci Ratios: Use Fibonacci retracement and Fibonacci extension tools to check the relationships between waves.
- Count the Corrective Waves: Once an impulse wave is complete, identify the subsequent three-wave (A-B-C) correction.
- Drill Down to Smaller Timeframes: Move to smaller timeframes to count the sub-waves within the larger waves, confirming the fractal nature of the pattern.
Elliott Wave in Forex vs Crypto vs Stocks
Elliott Wave Theory is a practical framework for trading, but its application varies depending on the market’s characteristics.
Elliott Wave in Stocks
In stock indices like the S&P 500, Elliott Wave is excellent for identifying long-term investment cycles. An analyst might identify the start of a major Wave 3 to enter a long-term buy-and-hold position. The rules, especially the no-overlap rule (Rule 3), are typically very reliable.
Elliott Wave in Forex
In the forex market (e.g., EUR/USD), the theory is often used for mid-term correction trades on 4-hour or daily charts. For a step-by-step foundation before applying wave counts, see our Forex Trading for Beginners guide, which explains the basics this theory builds on.. A trader might short a currency pair during a Wave C of a zigzag correction. Due to high liquidity and leverage, the patterns can be very clean, though Rule 3 is sometimes relaxed for diagonal patterns.
Elliott Wave in Crypto
The high volatility in cryptocurrencies like Bitcoin (BTC/USD) creates clear and often extended impulse waves. Traders frequently use Elliott Wave to identify and trade the powerful Wave 3 rallies. The patterns can be more exaggerated, and emotional sentiment plays a significant role in driving the waves.
Elliott Wave Trading Strategies
A common strategy is to trade in the direction of the impulse waves, particularly Wave 3, which offers the best risk-to-reward potential.
Elliott Wave Strategy Setup Checklist
- Entry: Enter a long position near the end of a corrective Wave 2, once the price starts to turn higher.
- Stop-Loss: Place a stop-loss just below the start of Wave 1, as a move below this level would invalidate the count.
- Profit Target: Set a profit target using Fibonacci extensions for the expected end of Wave 3 or Wave 5.
To improve accuracy, traders often integrate Elliott Wave with other technical indicators like the RSI or MACD. Equally important is learning how to manage risk in Elliott Wave setups, since even valid counts can fail when discipline and position sizing are ignored. A bullish divergence on the RSI at the bottom of a Wave 2 can provide strong confirmation to enter a long trade.
Advanced Elliott Wave Concepts
Beyond the basic patterns, the theory includes more complex ideas that add depth to the analysis.
- Fractals: Elliott Waves are fractal, meaning a completed 5-3 pattern on a weekly chart is just one or two waves of a larger pattern on a monthly chart. This nesting shows how Elliott fits into broader market structures in Forex, connecting waves to accumulation, expansion, and distribution phases.
- Wave Degrees: Elliott categorized waves into nine degrees to track patterns across multiple timeframes, from the Grand Supercycle (centuries) down to the Subminuette (minutes). This fractal design is tied to the mathematical rhythm of the Fibonacci sequence, which governs proportionality in wave development.
- Advanced Patterns: This includes Diagonals (wedge-shaped impulse waves signaling the end of a trend) and Truncations (a Wave 5 that fails to exceed Wave 3).
- Modern Interpretations: Newer approaches like NeoWave, developed by Glenn Neely, add more rules and complexity to increase objectivity. Analysts often connect wave psychology with the natural geometry of the Fibonacci spiral, reinforcing the idea that crowd behavior follows natural ratios.
- Indicator Tools: Platforms like TradingView offer Elliott Wave indicator tools that can help automate wave counting, though manual verification is still crucial.
Advantages of Elliott Wave Theory
- Predictive Framework: It provides a structured way to forecast potential future price movements.
- Universal Application: The theory can be applied to any liquid financial market and across all timeframes.
- Defined Risk Management: The three cardinal rules offer clear invalidation points, allowing traders to set logical stop-loss levels.
Limitations of Elliott Wave Theory
Despite its popularity, the Elliott Wave Theory is not without its critics.
- It’s Subjective: Two analysts can look at the same chart and come up with different valid wave counts.
- It Works Better in Hindsight: It is often easier to fit a wave pattern to historical price action than to use it for real-time forecasting.
- It’s Unreliable in Ranging Markets: The theory is most effective in trending markets.
Bottom Line
The Elliott Wave Theory offers a unique and structured lens through which to view the markets. By mapping the rhythm of crowd psychology, it provides traders with a proactive framework for forecasting trends and managing risk. While it requires discipline and practice, its ability to bring order to the apparent chaos of market movements makes it a valuable tool.


