The Abandoned Baby candlestick pattern is a rare and powerful three-candle formation, signaling significant trend reversals with distinct price gaps and a central Doji. It’s a crucial tool for traders aiming to anticipate major market turning points and capitalize on shifts in sentiment. This guide will teach you to identify both bullish and bearish forms, apply effective trading strategies with confirmation, and manage risks to improve your trading accuracy.
While understanding Abandoned Baby Candlestick is important, applying that knowledge is where the real growth happens. Create Your Free Forex Trading Account to practice with a free demo account and put your strategy to the test.
What is the abandoned baby candlestick pattern?

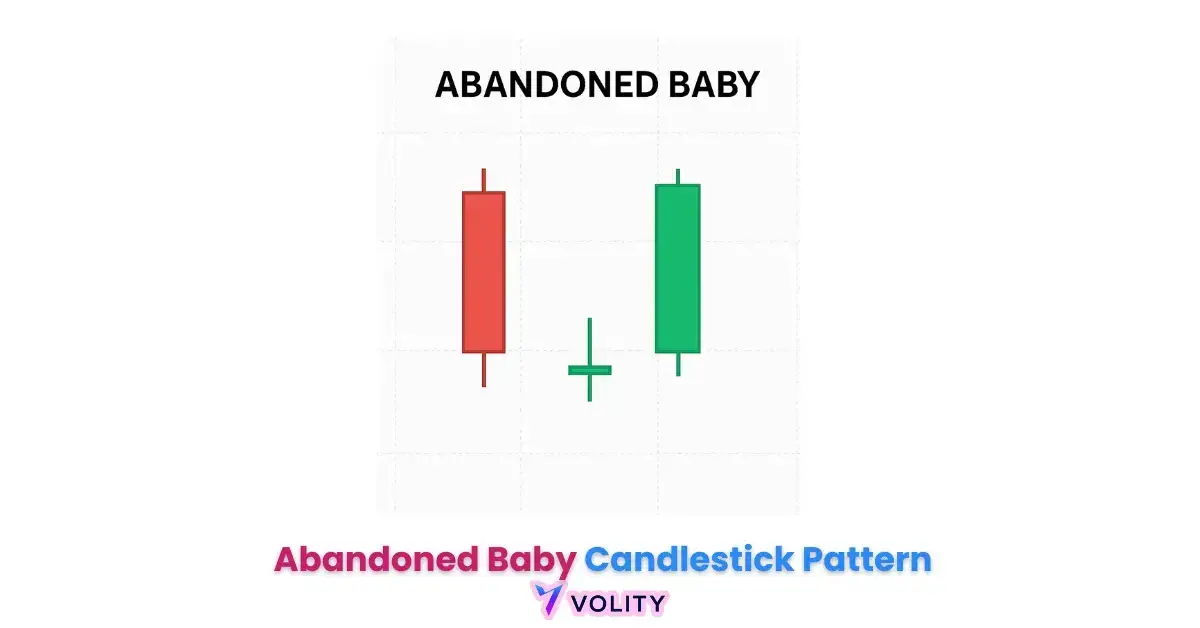
The Abandoned Baby candlestick pattern is a powerful reversal pattern in technical analysis, signaling a significant shift in market direction. Unlike other patterns, its core characteristic is the presence of distinct price gaps both before and after a central Doji candle.
This formation indicates a complete separation of the Doji from the preceding and succeeding candles, which is crucial for its validation. It is a three-candle reversal formation that signals a shift in market momentum, serving as a powerful indicator for traders looking to anticipate changes in a trend.
Candlestick patterns are a fundamental tool in technical analysis, offering visual insights into market sentiment and potential price movements. The pattern suggests that the prevailing trend is losing strength, and a reversal is imminent.
How does an abandoned baby candlestick pattern form?
The Abandoned Baby pattern forms with a unique three-candle structure, emphasizing price gaps and a Doji candle. It begins with a large candle moving in the direction of the current trend. This is followed by a gap in price, creating space between the first candle and the next.
The second candle is a Doji, signifying market indecision. A subsequent gap then forms in the opposite direction of the initial trend, followed by a large candle that moves against the original trend.
What does the abandoned baby pattern signify?
The Abandoned Baby pattern signifies a powerful reversal in market sentiment, indicating that the previous trend is exhausted. This three-candle formation reflects a dramatic shift where buyers or sellers, after dominating, lose control to the opposing force.
Both Bullish and Bearish Abandoned Baby patterns are considered strong reversal signals, suggesting a significant shift in market direction following a prolonged trend. It is a high-conviction signal for traders anticipating a major turnaround.
Bullish vs. Bearish Abandoned Baby Patterns

The Abandoned Baby pattern manifests in two primary forms, each signaling a distinct type of market reversal: Bullish Abandoned Baby and Bearish Abandoned Baby. Both types share the core structure of a Doji candle isolated by gaps, but they differ in their preceding trend and the direction of the subsequent price action.
These distinctions are vital for accurate interpretation and trading.
What is a bullish abandoned baby pattern?
A Bullish Abandoned Baby pattern signals a potential reversal from a downtrend to an uptrend. This formation occurs after a prolonged decline in price. The pattern starts with a long bearish candle, indicating strong selling pressure. This is followed by a gap down, creating a price void.
The second candle is a Doji, which opens and closes below the first candle, signaling indecision among traders at a new low. Finally, a large bullish candle forms, opening with a gap up from the Doji and moving significantly higher, confirming buyer dominance.
This sequence visually represents the “abandonment” of the Doji, left hanging below the previous and subsequent candles.
What is a bearish abandoned baby pattern?
A Bearish Abandoned Baby pattern indicates a potential reversal from an uptrend to a downtrend. This pattern typically appears after a sustained period of rising prices. It begins with a long bullish candle, showing strong buying momentum. A gap up then occurs, separating the first candle from the next.
The second candle is a Doji, opening and closing above the first candle, signifying uncertainty at a new high. The pattern concludes with a large bearish candle that opens with a gap down from the Doji and moves considerably lower, confirming seller control.
This formation visually leaves the Doji isolated above the surrounding candles, marking the shift in trend.
Ready to Elevate Your Trading?
You have the information. Now, get the platform. Join thousands of successful traders who use Volity for its powerful tools, fast execution, and dedicated support.
Create Your Account in Under 3 MinutesHow to Trade the Abandoned Baby Pattern
Trading the Abandoned Baby pattern effectively requires a clear strategy that integrates identification with robust confirmation from other technical analysis tools. While the pattern itself is a strong signal, relying solely on its visual formation can lead to false signals.
Therefore, combining it with volume analysis, momentum indicators, and an understanding of appropriate timeframes significantly increases its reliability. To trade the pattern, first, identify its precise formation: a three-candle sequence with distinct gaps isolating a central Doji candle. Once identified, wait for confirmation from subsequent price action or supporting indicators.
A general trading strategy involves planning an entry point after confirmation, setting a stop loss to manage risk, and establishing a target price based on previous support or resistance levels. This systematic approach helps to capitalize on the pattern’s strong reversal signal while mitigating potential losses.
Essential Confirmation Indicators for Higher Accuracy
Confirmation is critical for validating the Abandoned Baby pattern and reducing false signals. Traders frequently inquire about specific indicators to use for this purpose. An increase in Volume on the third candle of the pattern is a strong sign of conviction behind the reversal.
The Relative Strength Index (RSI) or Moving Average Convergence Divergence (MACD) can also provide momentum confirmation, showing divergence or a cross in the direction of the new trend. Additionally, the pattern forming at established Support and resistance levels further strengthens its reversal potential.
Day Trading and Beyond
The reliability of the Abandoned Baby pattern can vary significantly across different timeframes. While it can appear on any chart, it generally offers more reliable signals on longer timeframes, such as daily or weekly charts. Traders often ask if the pattern can be used for day trading; however, lower timeframes (e.g., 5-minute, 15-minute charts) tend to generate more false signals due to increased market noise. For day trading, higher conviction is needed, often requiring stricter confirmation criteria.
For swing trading or longer-term positions, the pattern on daily or 4-hour charts typically provides a clearer indication of a substantial trend reversal, making it a more suitable trading strategy.
Abandoned Baby vs. Other Reversal Patterns
Understanding how the Abandoned Baby pattern compares to other common reversal patterns, such as the Morning Star and Evening Star, helps traders differentiate their signals and potential reliability. While all three indicate a shift in trend, their specific formations and gap requirements vary.
| Formation | 3 candles, middle Doji | 3 candles, middle small body | 3 candles, middle small body |
| Gaps | Mandatory gap before & after Doji | Gap before middle candle | Gap before middle candle |
| Reliability | High (strong gaps) | Moderate-High | Moderate-High |
| Implication | Strong reversal | Bullish reversal | Bearish reversal |
| Example | Downtrend-Doji-Uptrend | Downtrend-Small-Uptrend | Uptrend-Small-Downtrend |
Entry, Exit, and Risk Management
Successfully trading the Abandoned Baby pattern involves not just identifying the signal but also executing a precise trading strategy with defined entry and exit points, coupled with robust risk management. This proactive approach protects capital and maximizes potential gains from the reversal.
What is a good entry point after an abandoned baby pattern?
A good entry point after an Abandoned Baby pattern often occurs on the open of the candle immediately following the pattern’s completion, especially after strong confirmation. For a Bullish Abandoned Baby, this means entering on the open of the fourth candle, which should be bullish.
Conversely, for a Bearish Abandoned Baby, the entry would be on the open of the fourth candle, which should be bearish. Some traders prefer to wait for a slight retest of the pattern’s high or low for a more conservative entry, making sure the new trend is established.
Where should I place a stop loss for an abandoned baby pattern?
- Placing a stop loss is a core risk management principle to protect your capital
- For a Bullish Abandoned Baby, the stop loss should be placed just below the low of the Doji candle, or slightly below the low of the entire pattern
- This placement makes sure that if the reversal fails and price continues its prior downtrend, losses are minimized
- For a Bearish Abandoned Baby, the stop loss should be set just above the high of the Doji candle, or slightly above the high of the entire pattern
This strategy directly addresses common trader struggles with stop loss placement, aiming to prevent premature hits while maintaining protection.
What is the target price after an abandoned baby pattern?
Setting a target price after an Abandoned Baby pattern involves identifying potential areas where the new trend might encounter resistance or support. Common methods include using previous support and resistance levels that align with the new trend’s direction. For a bullish reversal, look for prior resistance zones as potential profit targets.
For a bearish reversal, identify previous support zones. Fibonacci extensions can also be used to project potential price targets based on the length of the preceding trend and the pattern’s formation.
What are the risks of trading the abandoned baby pattern?
Trading the Abandoned Baby pattern carries inherent risks, like any technical analysis tool. The primary risk is the potential for false signals, especially on lower timeframe charts or without adequate confirmation. Market conditions, such as low liquidity or sudden news events, can invalidate the pattern rapidly. Therefore, a comprehensive risk management approach is essential.
This includes proper position sizing, making sure that only a small percentage of capital is risked per trade (e.g., 1-2%), and diversifying across different assets. Understanding these risks is crucial for long-term trading success.
Turn Knowledge into Profit
You've done the reading, now it's time to act. The best way to learn is by doing. Open a free, no-risk demo account and practice your strategy with virtual funds today.
Open a Free Demo AccountReliability, Backtesting, and Trading Psychology
While the Abandoned Baby pattern is a recognized reversal signal, its real-world effectiveness often varies, and psychological factors play a significant role in trading outcomes. Understanding the statistical reliability and psychological pitfalls of the Abandoned Baby pattern provides a significant edge over traders who rely solely on mechanical identification.
Open Price vs. Body Gap
A critical detail often overlooked in basic guides is the precise definition of the gap for the Abandoned Baby pattern. Many traders inquire if the gap refers solely to the opening price, or if the entire candle body must gap away from the previous candle’s body.
For accurate identification, the gap should ideally be between the entire range of the candles, meaning the second candle’s high/low (including wicks) should be entirely outside the first candle’s high/low. This strict interpretation, where the Doji is truly “abandoned” with no overlap, reduces the likelihood of false signals and addresses concerns about misidentifying the pattern.
How to backtest the abandoned baby pattern strategy?
Backtesting the Abandoned Baby pattern strategy involves applying the pattern’s rules to historical price data to evaluate its performance. This process requires defining clear entry, exit, and stop-loss criteria, then systematically checking how the strategy would have performed. Traders can use specialized software or manually review charts across various assets and timeframes.
Backtesting across various assets and timeframes shows the Abandoned Baby pattern’s success rate can vary widely, emphasizing the need for robust confirmation and risk management.
This highlights that pattern reliability statistics are not constant and require thorough personal verification.
Trading with Discipline
Psychological biases significantly impact trading decisions, often leading to misinterpretation of patterns and generating false signals. Confirmation bias, for instance, can cause traders to see an Abandoned Baby pattern where none exists, simply because they expect a reversal.
Fear of missing out (FOMO) can push traders into premature entries, while revenge trading leads to irrational decisions after a loss. Developing discipline involves adhering to a predefined trading strategy, maintaining a trading journal to review decisions, and practicing emotional detachment.
By recognizing and managing these biases, traders can improve their pattern interpretation and overall trading performance, building a more controlled approach to market sentiment.
Key Takeaways
- The Abandoned Baby pattern is a powerful three-candle reversal signal, characterized by distinct price gaps isolating a central Doji candle.
- It comes in Bullish (downtrend to uptrend) and Bearish (uptrend to downtrend) forms, both indicating a significant shift in market sentiment.
- Effective trading requires confirmation from indicators like Volume, RSI, or MACD, and careful consideration of the timeframe.
- Robust risk management, including precise entry point, stop loss, and target price placement, is crucial for success.
- Understanding pattern reliability statistics and managing psychological biases provides a significant edge, moving beyond mechanical identification.