The Aroon indicator is a powerful technical analysis tool designed to identify the presence, strength, and potential reversal points of an asset’s price trend. Comprising Aroon Up and Aroon Down lines, it oscillates between 0 and 100, offering clear insights into market dynamics. This guide will teach you how the indicator works, its optimal settings for Forex, how to combine it with other tools, and how to apply it for more informed trading decisions.
While understanding Aroon Indicator is important, applying that knowledge is where the real growth happens. Create Your Free Forex Trading Account to practice with a free demo account and put your strategy to the test.
What is the Aroon indicator?
The Aroon indicator is a technical analysis tool that identifies the presence, strength, and potential reversal points of a trend in an asset’s price. It comprises two lines: Aroon Up and Aroon Down, which oscillate between 0 and 100.
This indicator is particularly effective in Forex trading due to the market’s high liquidity and frequent trending periods, helping traders pinpoint opportune entry and exit points.
Who invented the Aroon indicator?
The Aroon indicator was developed by Tushar Chande in 1995 to identify the beginning of a new trend and its strength. Chande, a respected figure in technical analysis, also created other momentum-based tools such as the Chande Momentum Oscillator.
His work focuses on quantifying the strength and direction of price movements over specific periods, providing traders with clearer market insights.
How does the Aroon indicator work?
The Aroon indicator functions by tracking the number of periods since the last highest high and lowest low within a specified lookback period. It consists of two lines: Aroon Up and Aroon Down, which move between 0 and 100.
The interplay between these lines reveals the prevailing trend’s direction and momentum, with crossovers often signaling potential trend changes or continuations.
What does Aroon Up mean?
Aroon Up measures the number of periods since the highest high occurred within the specified lookback period. A high Aroon Up value, typically above 70, indicates that new highs are being consistently made, signaling a strong uptrend. Conversely, a low Aroon Up value, below 30, suggests that new highs are not occurring, implying a weak or absent uptrend. The calculation formula for Aroon Up is ((Number of periods - Periods since N-period high) / Number of periods) * 100.
What does Aroon Down mean?
Aroon Down measures the number of periods since the lowest low occurred within the specified lookback period. A high Aroon Down value, typically above 70, indicates that new lows are consistently being made, signaling a strong downtrend. A low Aroon Down value, below 30, suggests that new lows are not occurring, implying a weak or absent downtrend. The calculation formula for Aroon Down is ((Number of periods - Periods since N-period low) / Number of periods) * 100.
How Aroon Up and Down work together for trend identification
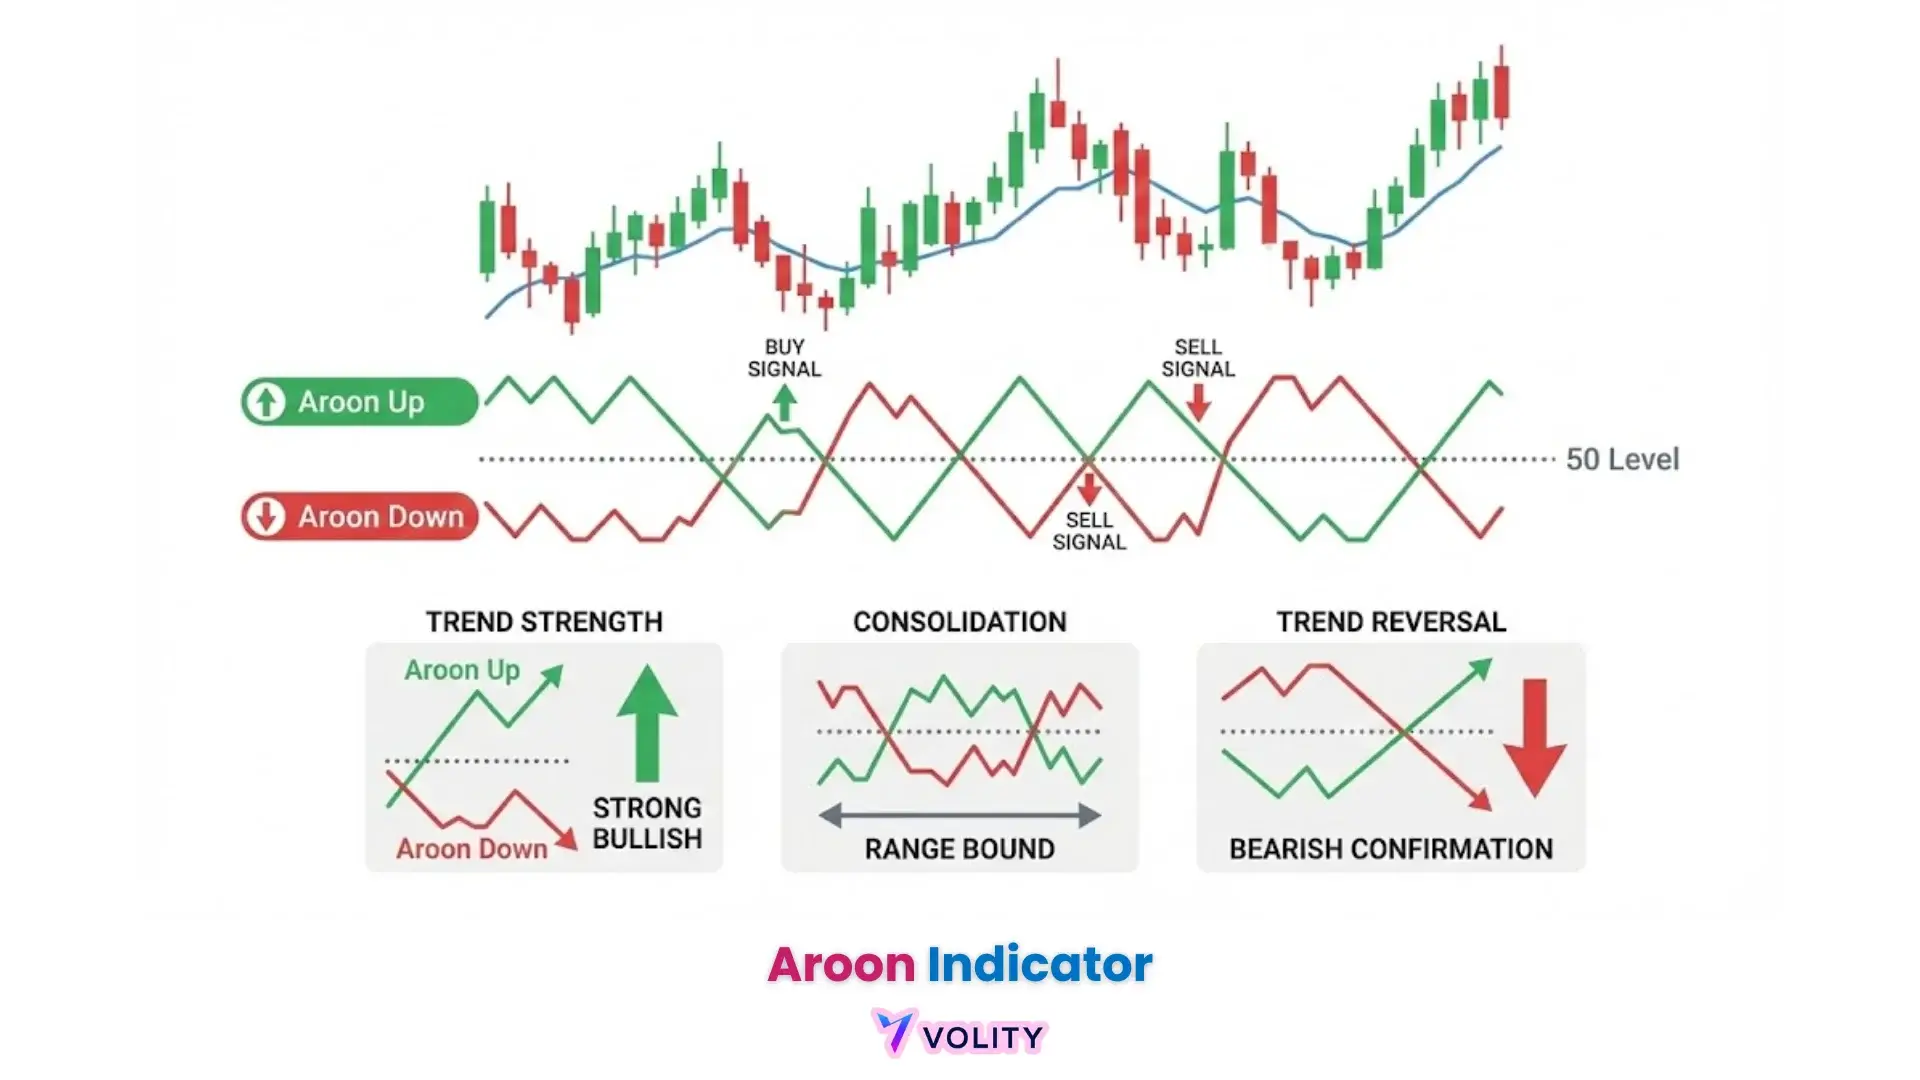
Aroon Up and Aroon Down work in tandem to provide a comprehensive view of trend identification and trend strength. When Aroon Up is above Aroon Down, it indicates an uptrend, with the trend strengthening as Aroon Up approaches 100 and Aroon Down approaches 0. Conversely, when Aroon Down is above Aroon Up, it signals a downtrend, with strength increasing as Aroon Down nears 100 and Aroon Up nears 0.
Aroon Up and Aroon Down lines range from 0 to 100, where values above 70 generally indicate a strong trend in that direction, while values below 30 suggest a weak trend or consolidation. Crossovers, where one line crosses above the other, often signal potential trend changes. For instance, Aroon Up crossing above Aroon Down suggests a potential shift from a downtrend to an uptrend.
Ready to Elevate Your Trading?
You have the information. Now, get the platform. Join thousands of successful traders who use Volity for its powerful tools, fast execution, and dedicated support.
Create Your Account in Under 3 MinutesHow to use Aroon indicator for trend strength?
To use the Aroon indicator for trend strength, observe the values of the Aroon Up and Aroon Down lines and their relative positions. When Aroon Up is high (above 70) and Aroon Down is low (below 30), it confirms a strong uptrend.
Conversely, a high Aroon Down (above 70) and low Aroon Up (below 30) indicate a strong downtrend. If both lines remain low (below 30) and move close to each other, it suggests a consolidation period or a weak, range-bound market, indicating a lack of clear trend strength.
Can Aroon indicator predict reversals?
The Aroon indicator can signal potential reversal signals, but it does not definitively predict them. Crossovers between the Aroon Up and Aroon Down lines are key indicators. For example, if Aroon Up crosses below Aroon Down after an extended uptrend, it suggests that the upward momentum is weakening and a downtrend may be beginning.
Similarly, if Aroon Down crosses below Aroon Up after a downtrend, it indicates a potential shift to an uptrend. Traders should always seek confirmation from other indicators or price action before making entry/exit points based solely on Aroon reversal signals.
What are the best settings for the Aroon indicator in forex?
- The best settings for the Aroon indicator in Forex often depend on a trader’s strategy and the specific currency pair.
- The standard lookback period for the Aroon indicator is 25 periods, though 14 periods is also commonly used, especially for shorter-term analysis.
Choosing the Right Timeframe for Forex Trading
Selecting the right timeframe is crucial for effective Forex trading with the Aroon indicator. For scalping or day trading, shorter timeframes like the 1-hour or 4-hour charts might be preferred, using the 14-period setting for sensitivity.
Swing traders or long-term position traders often benefit from daily or weekly charts with the standard 25-period setting, which provides more reliable, less frequent signals. Using an inappropriate timeframe can lead to mixed signals and frustration, emphasizing the need to align the timeframe with your trading style.
Customizing Aroon Settings for Specific Forex Pairs
Unlike many guides, traders can experiment with custom Aroon settings beyond the standard 14 or 25 periods. This customization can be particularly beneficial for specific currency pairs that exhibit unique volatility or trending characteristics.
For instance, a highly volatile pair might benefit from a slightly longer lookback period to reduce noise, while a less volatile pair might respond better to a shorter period for earlier signal detection. Tailoring settings can help to reduce false signals and optimize the indicator’s performance for individual trading preferences and market conditions.
Is Aroon Oscillator the same as Aroon Indicator?
No, the Aroon Oscillator is not the same as the Aroon Indicator, although they are closely related. The fundamental difference lies in their presentation and calculation. The Aroon Indicator consists of two distinct lines, Aroon Up and Aroon Down, which individually measure the time since the last high and low. While the Aroon Indicator measures the time since recent highs/lows, the Aroon Oscillator calculates the difference between Aroon Up and Aroon Down, providing a single line for easier visualization of trend strength and potential reversals.
A Side-by-Side Comparison
Understanding the differences between the Aroon Indicator and the Aroon Oscillator is crucial for effective trend identification. Each tool offers a unique perspective on market dynamics, catering to different analytical preferences.
| Feature | Aroon Indicator | Aroon Oscillator |
| Components | Two lines: Aroon Up, Aroon Down | Single line |
| Calculation | Time since N-period high/low | Aroon Up – Aroon Down |
| Range | 0 to 100 for each line | -100 to +100 |
| Interpretation | Relative position of lines, crossovers | Crossovers of zero line, value extremes |
| Best Use Cases | Early trend detection, consolidation | Trend strength visualization, momentum |
The Aroon Indicator is ideal for identifying the beginning of a trend and periods of consolidation, watching the individual movements of Aroon Up and Down.
The Aroon Oscillator, on the other hand, provides a more direct measure of trend strength and momentum, with values above zero indicating an uptrend and values below zero indicating a downtrend.
Traders seeking a clearer, single-line representation of momentum often prefer the oscillator, while those who want to see the individual contributions of highs and lows use the indicator.
How to combine Aroon with other indicators?
To combine Aroon with other indicators effectively, traders can use momentum oscillators like RSI or MACD for confirmation, or trend-following indicators such as Moving Averages for filtering.
Combining the Aroon indicator with a momentum oscillator like RSI or MACD can help filter out false signals, potentially reducing erroneous entries by 20-30% in volatile Forex markets compared to using Aroon alone.
For instance, an Aroon Up crossover signaling a new uptrend gains stronger validity if the RSI simultaneously moves out of oversold territory or the MACD shows a bullish crossover above its signal line.
Similarly, using a 20-period Moving Average can help filter Aroon signals; only take Aroon buy signals if the price is above the moving average. This layered approach forms a more robust trading strategy.
What are the limitations of the Aroon indicator?
The Aroon indicator has limitations, primarily its susceptibility to false signals, especially in choppy markets or sideways market conditions. As a trend-following indicator, Aroon performs optimally during clear, sustained trends.
In range-bound or highly volatile, non-trending Forex trading environments, the Aroon Up and Aroon Down lines can oscillate rapidly, generating frequent crossovers that do not lead to actual trend changes. This can result in numerous losing trades.
Traders must learn to identify these market conditions and either avoid trading with Aroon or use additional filtering indicators to mitigate false signals.
How to set up Aroon indicator in MetaTrader 4/5?
Setting up the Aroon indicator in MetaTrader 4/5 is a straightforward process, as it is often a built-in feature. First, open your MT4/MT5 platform and navigate to the desired currency pair chart. Next, from the top menu, select “Insert” -> “Indicators” -> “Oscillators” -> “Aroon.”
A dialog box will appear, allowing you to adjust the indicator’s parameters, such as the period (e.g., 14 or 25) and line colors. Once confirmed, the Aroon indicator will appear in a separate window below your main price chart, ready for analysis.
Where to download Aroon indicator for MT4?
The Aroon indicator is typically a built-in indicator within MetaTrader 4/5, meaning you usually don’t need to download it. However, if you’re looking for custom versions that might include additional features like alerts or specific display options, you can find them on dedicated Forex forums and marketplaces. Websites like ForexFactory.com offer a wide range of custom indicators, including various iterations of the Aroon indicator, which can be downloaded and installed into your MT4/MT5 platform. For advanced users interested in algorithmic trading or backtesting, implementing the Aroon logic in Python is also an option, allowing for greater customization and integration with complex trading systems.
Turn Knowledge into Profit
You've done the reading, now it's time to act. The best way to learn is by doing. Open a free, no-risk demo account and practice your strategy with virtual funds today.
Open a Free Demo AccountHow to Trade the Aroon Indicator
Translating Aroon indicator signals into actionable trades requires a structured trading strategy. First, identify the dominant trend using Aroon Up and Aroon Down. A strong uptrend (Aroon Up > 70, Aroon Down < 30) suggests looking for long entry/exit points. Conversely, a strong downtrend (Aroon Down > 70, Aroon Up < 30) indicates short opportunities.
Use crossovers as potential entry signals, but always confirm with a secondary indicator (like RSI or MACD) or price action patterns. Set your stop-loss based on recent support/resistance levels and your take-profit based on a favorable risk-reward ratio, such as 1:2 or 1:3.
Understanding & Overcoming Losses
Experiencing losses when using Aroon can be disheartening, but it often stems from common pitfalls rather than the indicator itself. A primary reason for failure is trading in choppy markets or sideways market conditions, where Aroon generates frequent false signals.
Another common issue is the lack of confirmation from other indicators or price action, leading to premature entries or exits. The psychology of trend following also plays a significant role; fear of missing out (FOMO) can lead to chasing late signals, while emotional trading can cause traders to abandon their strategy after a few losses.
Overcoming these challenges involves strict risk management, patience, and continuous backtesting to understand Aroon’s performance across different market conditions.
Bottom Line
The Aroon indicator is an invaluable tool for Forex trading, offering clear insights into trend identification and trend strength. By analyzing the interplay of its Aroon Up and Aroon Down lines, traders can pinpoint the emergence of new trends and gauge their momentum.
While powerful, understanding its nuances, such as the distinction from the Aroon Oscillator and its limitations in sideways markets, is crucial for successful application. Optimizing settings, combining it with other indicators like RSI or MACD, and addressing the psychology of trend following can significantly improve its effectiveness.
Ultimately, integrating Aroon into a well-defined trading strategy empowers traders to make more informed decisions in the dynamic Forex market.
Key Takeaways
- The Aroon indicator uses Aroon Up and Aroon Down lines to identify trend presence, strength, and potential reversals.
- Aroon Up measures periods since the highest high, while Aroon Down measures periods since the lowest low, both oscillating between 0 and 100.
- High Aroon Up and low Aroon Down signal an uptrend, while the opposite indicates a downtrend.
- Crossovers between Aroon Up and Aroon Down can signal potential trend changes, but require confirmation from other indicators.
- Optimal settings for the Aroon indicator vary, with 14 or 25 periods being common, depending on the timeframe and currency pair.
- The Aroon Oscillator is a single line derived from the difference between Aroon Up and Aroon Down, offering a direct measure of momentum.
- Combining Aroon with other indicators like RSI, MACD, or Moving Averages can help filter false signals and enhance trading strategies.
- The Aroon indicator is susceptible to false signals in choppy or sideways markets, emphasizing the need for additional confirmation and risk management.