Investing in financial products involves risk. Losses may exceed the value of your original investment.
Bitcoin price rallies is a core topic for traders in 2026. The complete guide follows.
Crypto news digest: Bitcoin back above $70,000 as ceasefire calms nerves
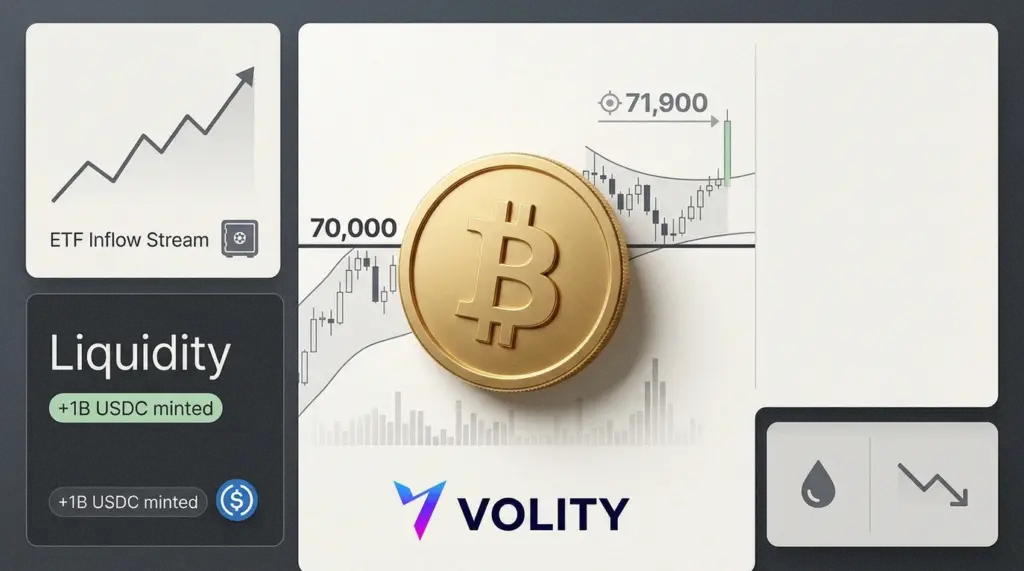
Bitcoin seized $70,000 again on Monday after President Trump announced a two week ceasefire with Iran. Risk appetite returned fast, therefore crypto’s weekend wobble turned into a clean relief rally. BTC changed hands near $71,900 at the highs, up roughly $3,600 from Sunday’s lows. Meanwhile, Ether climbed to about $2,254, helped by a fresh burst of stablecoin issuance and steadier flows into large venues.
Traders had spent the prior session trying to price two markets at once. Oil spiked toward $115 as investors pictured a wider regional flare up. However, the ceasefire headline pulled crude back from the extremes and eased the immediate inflation scare. Crypto followed, yet the tone felt less euphoric than mechanical, with desks pointing to liquidations, ETF allocations and spot spread tightening rather than any new “digital gold” narrative.
Geopolitics cools, charts heat up
BTC dipped close to $68,000 before snapping higher into the New York open, then ground up through the $70,000 handle. Technicians flagged a tightening range that resembles an ascending triangle, so a decisive hold above $70,000 matters more than the intraday spike. Meanwhile, market makers described better two way interest, with buyers returning once oil backed off and volatility sellers reappeared in the options complex.
Energy headlines still sat in the background. Gasoline prices in Los Angeles pushed above $6 in some areas, therefore the macro crowd kept one eye on inflation expectations. However, crypto’s response suggested traders treated the ceasefire as a permission slip to re risk, not as proof that Bitcoin thrives on conflict.
Institutions nudge positioning again
On the flows front, the day’s most watched transfer came from BlackRock linked wallets that shifted about $49 million of BTC and ETH to Coinbase Prime. That does not automatically mean selling. However, it usually signals rebalancing, collateral moves, or preparation for creations and redemptions tied to ETF plumbing.
Meanwhile, Wall Street’s spot ETF trade kept spreading. Morgan Stanley launched the MSBT Bitcoin ETF on NYSE Arca, adding yet another conduit for traditional accounts. While each new wrapper does not change supply, it does broaden the buyer base, therefore it can matter at the margin during breakout attempts.
Coinbase also chalked up a regulatory win in Australia, extending its reach in futures and options. That matters because derivatives liquidity often leads spot, and offshore depth tends to migrate to the most trusted venues when headlines turn sharp.
Stablecoins roar, DeFi keeps dealmaking
Circle minted roughly $1 billion of USDC within 24 hours, matching the narrative of institutional sized flows moving back into on chain rails. Stablecoin supply is not a price guarantee. However, it often arrives before leverage returns, therefore it can foreshadow a more active trading tape in majors and perps.
Elsewhere, deal chatter stayed busy. Polygon Labs explored a $100 million raise for payments expansion. Pharos Network raised $44 million to build infrastructure for tokenised real world assets. Polymarket bought Brahma to deepen its DeFi stack, after posting about $7.1 million in weekly fees as prediction markets keep pulling attention.
Price watch: breakouts, traps, and crowded trades
In altcoins, the mood stayed selective. Hyperliquid bulls pointed to a bull flag setup and talked about $44 as a target, while XRP traders watched $1.30 as the nearest line in the sand after a failed push through $1.35. Meanwhile, Uniswap jumped on a squeeze in perps yet remained trapped in its broader range, which is exactly where late longs tend to get punished.
Ethereum’s bid looked better supported than last week because stablecoin supply hit fresh highs and ETH held key support levels. However, the market still lacks a single dominant macro tailwind, therefore traders may keep selling rallies until BTC proves it can build time above $70,000.
Regulation and the AI side show
Regulatory tone stayed mixed. The SEC acknowledged that some earlier crypto cases misread how securities law applies, which markets took as a modest de escalation signal. However, the bigger US bills remained tangled, with the CLARITY Act stuck in a Senate fight. Abroad, Thai regulators continued probing shareholder funding links in crypto names, while US lawmakers pressed the CFTC on prediction market safeguards.
Meanwhile, the AI crypto crossover pushed forward, with new open source tooling for agent control and fresh infrastructure pitches. Some projects promised “AI rails” and batching standards. However, most of that trade still behaves like a sentiment proxy, not a cashflow story.
By the numbers
- BTC session high near $71,906, after dipping toward $68,000.
- ETH around $2,254, tracking stablecoin supply growth.
- USDC issuance about $1 billion in 24 hours.
- BlackRock linked move of about $49 million in BTC and ETH to Coinbase Prime.
- Oil cooled from peaks near $115 to $116 after the ceasefire headline.
Key takeaways
- Watch whether $70,000 turns into support, because failed retests often trigger fast deleveraging.
- Track ETF related flows and Prime transfers, since they can hint at creation redemption mechanics.
- Stablecoin issuance supports liquidity, yet it can also precede a leverage build, therefore mind funding rates.
- Keep an eye on energy prices, because a renewed spike can tighten financial conditions quickly.
- Altcoin moves look tactical, so size positions around liquidity, not narratives.
For more on this topic see our deep-dives on Bitcoin Price Action and Ethereum’s Censorship Resistance Push, Crypto Market Rebound: Expert Bitcoin Forecasts After the Crash, and Bitcoin and Geopolitical Risk: How BTC Reacts to Middle East Tension.
What our analysts watch: Three readings dominate any flow-led rally check on the Volity desk. Net spot ETF creations broken down by issuer (BlackRock IBIT and Fidelity FBTC together set the institutional tone).
CME bitcoin futures basis (annualised premium of front-month over spot) tells us whether cash-and-carry money is adding or trimming risk. Tether and USDC weekly net issuance shows whether the buying capacity is being replenished or drawn down.
When ETF flow rises, basis holds, and stablecoin issuance grows, the rally has the cleanest structural support we read.
Frequently asked questions
Why does CME basis matter when reading an ETF-led rally?
The cash-and-carry trade (long spot via ETF, short CME futures) requires a positive basis to be profitable. When basis compresses while ETF flows print positive, the trade is being unwound, which means part of the spot demand reflects basis exit rather than directional conviction. The CME bitcoin futures specifications document the institutional contract mechanics.
How fast can ETF flows reverse during a market shock?
Single-day reversals from positive to negative net flow are common around macro events (FOMC, CPI, geopolitical shocks). Sustained reversals require a persistent change in the macro narrative, which usually unfolds over one to three weeks rather than one session. The U.S. SEC publishes the registered S-1 filings that document the creation-redemption mechanism.
Does stablecoin issuance reliably precede crypto rallies?
Issuance growth is correlated but not strictly leading. Tether and USDC supply expands when authorised dealers anticipate buying demand, which usually arrives a few days to a few weeks ahead of the spot move. It is one input in a flow-quality dashboard rather than a standalone signal. The Federal Reserve research on stablecoin flows covers the empirical relationship.
How does a ceasefire headline change ETF flow behaviour?
De-escalation reduces the macro tail risk that suppressed allocator engagement, which usually triggers a multi-day cluster of positive ETF prints. The headline itself is rarely the trade; the flow response over the next three to five sessions is. The IMF fintech research hosts work on how macro shocks transmit through digital-asset flows.
Related guides
- Bitcoin explained
- Ethereum explained
- Cryptocurrency trading
- Crypto trading platforms
- Best crypto investments
Volity operates a trading platform and also publishes educational and analytical content about trading. The content on this page is for educational purposes only and should not be considered financial advice. Volity may benefit commercially when readers open trading accounts through links on this site.
Our content is produced and reviewed under documented editorial standards; comparison and review methodology is published here.