The cup and handle pattern is a powerful tool in technical analysis, offering insights into potential bullish price movements and trend continuation. This guide will help you understand, accurately identify, and effectively trade this pattern. You will learn strategies to minimize risks and maximize profit potential in the market.
While understanding Cup And Handle Pattern is important, applying that knowledge is where the real growth happens. Create Your Free Forex Trading Account to practice with a free demo account and put your strategy to the test.
Understanding the Cup and Handle Pattern
The cup and handle pattern is a recognizable chart formation in technical analysis that typically signals a continuation of an existing uptrend. It is considered a bullish continuation pattern, suggesting that a security’s price is likely to rise further after a period of consolidation. This pattern was first introduced by William J. O’Neil, a renowned investor and founder of Investor’s Business Daily, in his seminal 1988 book, ‘How to Make Money in Stocks.’ His research, based on analyzing numerous successful stocks, highlighted the pattern’s effectiveness in predicting significant price advances. The pattern essentially depicts a period where a stock’s price pulls back and forms a base before resuming its upward trajectory, making it a valuable tool for traders seeking entry points in strong trends.
What is a cup and handle pattern?
The cup and handle pattern is a bullish continuation formation that indicates a likely upward trend once the pattern is completed, suggesting that the previous uptrend will resume. This pattern was introduced by William J. O’Neil in his 1988 book, ‘How to Make Money in Stocks,’ based on his analysis of successful stocks. It signals a period of consolidation followed by a breakout.
What does a cup and handle pattern indicate?
A cup and handle pattern indicates that a security’s price has undergone a period of consolidation with a bullish bias, suggesting that buyers are regaining control after a temporary pause in an uptrend. The pattern implies that sellers attempted to push the price lower but failed, leading to a base formation before another upward move. This often reflects a shift in market sentiment towards optimism.
How to identify a cup and handle pattern?
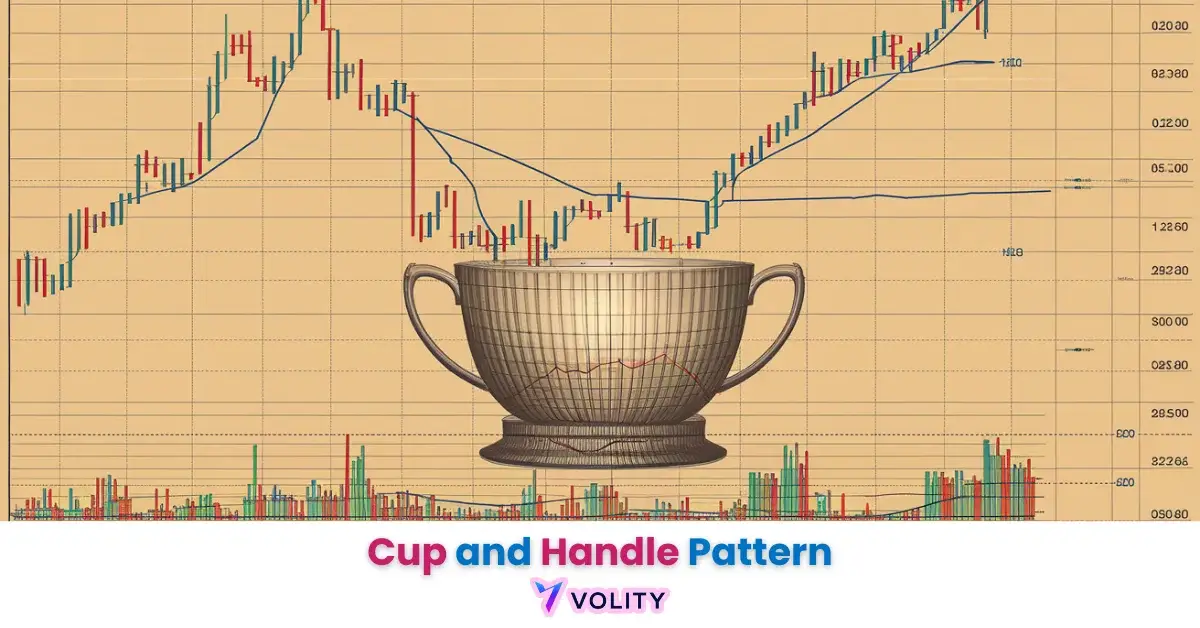
Identifying a cup and handle pattern involves recognizing two distinct components: a “cup” followed by a “handle.” The cup should resemble a ‘U’ shape, indicating a gradual decline and recovery in price, while the handle is a smaller, often downward-sloping consolidation period. Proper identification requires attention to shape, depth, duration, and crucially, volume dynamics.
Identifying a valid cup and handle pattern requires a clear understanding of its two primary components: the cup and the handle. The cup typically forms a ‘U’ shape, resembling a rounded bottom or saucer. This U-shaped formation should ideally be symmetrical, indicating a gradual decline in price followed by an equally gradual recovery to the original highs. A common duration for the cup ranges from one to six months, though it can extend longer. A ‘V’ shaped cup is generally considered less reliable, as it suggests a sharper, less stable recovery. The handle forms on the right side of the cup, often resembling a small flag or pennant, and represents a final period of consolidation. It typically involves a slight downward drift or sideways movement, ideally not dropping below 50% of the cup’s depth. The handle should also form on lower trading volume, indicating reduced selling pressure. The breakout, or upward move, usually occurs once the price surpasses the resistance level established by the cup’s rim.
Here are the ideal characteristics for identifying a cup and handle pattern:
| Component | Ideal Characteristic | Signal |
| Cup Shape | Rounded ‘U’ shape | Gradual reversal |
| Cup Depth | 1/3 to 1/2 of prior move | Healthy correction |
| Cup Duration | 1 to 6 months | Sufficient consolidation |
| Handle Shape | Downward drift/flag | Final consolidation |
| Handle Depth | < 50% of cup depth | Weak selling pressure |
| Volume | Declining then rising | Accumulation phase |
Volume, Resistance, and Breakout Confirmation
Confirming a cup and handle pattern extends beyond visual identification of the cup and handle shapes; it critically involves analyzing volume and pinpointing the resistance level for an eventual breakout. These elements provide the necessary validation for a high-probability trading setup. Without proper volume confirmation and a clear breakout from resistance, the pattern’s reliability diminishes significantly.
What is the significance of volume in cup and handle?
The significance of volume in a cup and handle pattern is paramount for confirming its validity and predicting a successful breakout. Declining volume during the cup formation and increasing volume during the handle and breakout are typical signals. During the formation of the cup, volume should generally decline as the price bottoms, indicating a lack of selling interest. As the price recovers towards the cup’s rim, volume may increase slightly. Within the handle, volume should be light, reflecting a period of low trading activity and consolidation. The most crucial volume signal occurs during the breakout, where a sharp and significant increase in volume is expected. This surge in volume confirms strong buying interest and validates the pattern’s completion.
Here’s a comparison of good vs. bad volume signals in a cup and handle pattern:
| Stage | Good Volume Signal | Bad Volume Signal |
| Cup Formation | Declining | High/Inconsistent |
| Cup Bottom | Very Low | High |
| Handle | Light, Declining | High/Rising |
| Breakout | Significant Surge | Low/Average |
How to confirm a cup and handle pattern?
To confirm a cup and handle pattern, focus on identifying the resistance level formed by the cup’s rim and observing a decisive breakout from this level. The resistance level is drawn by connecting the two peaks that form the top edges of the cup. This line represents the prior high that the price struggled to overcome. A valid breakout occurs when the price closes decisively above this resistance level, ideally accompanied by a substantial increase in trading volume. This strong, decisive move above resistance, supported by high volume, acts as the primary trigger for a trade and confirms the pattern’s bullish implications. Without a clear and strong breakout, the pattern may fail, leading to false signals.
Ready to Elevate Your Trading?
You have the information. Now, get the platform. Join thousands of successful traders who use Volity for its powerful tools, fast execution, and dedicated support.
Create Your Account in Under 3 MinutesHow to Trade the Cup and Handle Pattern
A well-defined trading plan is essential to capitalize on the pattern’s potential while effectively managing inherent market risks. This requires understanding both aggressive and conservative approaches to trade initiation and capital protection.
What are the entry and exit points for cup and handle?
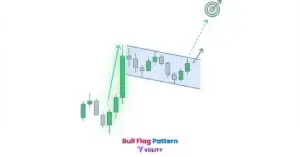
Optimal entry points for a cup and handle pattern typically occur at two stages: either aggressively on the breakout from the handle or more conservatively on a retest of the breakout level. An aggressive entry involves buying as the price definitively closes above the resistance level, confirmed by a significant surge in volume. This captures the initial momentum of the move. A conservative entry involves waiting for the price to break out, then pull back to retest the former resistance level (which often acts as new support) before continuing its upward trajectory. Both strategies aim to capitalize on the confirmed bullish move, with the conservative approach offering slightly reduced risk but potentially missing some initial upside.
How to trade cup and handle pattern with examples?
To trade a cup and handle pattern, measure the price target by projecting the cup’s depth upward from the breakout point, and plan exits based on this target or other market signals. For example, if a stock forms a cup from $50 down to $40 and then recovers to $50, the cup’s depth is $10. If the breakout occurs at $50, the projected price target would be $60 ($50 + $10). Beyond this calculated target, traders may use other exit strategies such as trailing stops, or partial profit-taking at intermediate resistance levels to lock in gains and manage risk as the trade progresses.
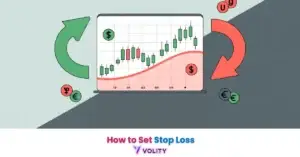
What’s the best stop loss for cup and handle?
- Placing the stop loss below the handle’s low ensures that if the pattern invalidates and the price falls back into the handle or below, your capital is protected.
- Alternatively, setting it just below the low of the candle that initiated the breakout can be effective for tighter risk control, especially if the handle is very shallow.
- The goal is to define a point where the bullish thesis of the pattern is clearly broken, preventing larger losses.
Understanding the Inverted Cup and Handle Pattern
Just as there is a bullish cup and handle pattern, there exists its bearish counterpart: the inverted cup and handle pattern. Recognizing the differences between these two is crucial for comprehensive technical analysis. While the traditional pattern signals upward movement, the inverted version indicates a likely downward trend, offering opportunities for short-selling or avoiding potential losses.
Cup and handle vs inverted cup and handle.
The inverted cup and handle pattern is a bearish reversal formation, signifying a potential downward trend, in contrast to the bullish continuation implied by the standard cup and handle. This pattern appears as an upside-down ‘U’ shape for the cup, indicating a price rally followed by a decline back to the initial level. The handle then forms as a small, upward-sloping consolidation period, typically on low volume, signaling a brief pause before a breakdown. Volume dynamics are reversed compared to the bullish pattern; initial high volume during the rally, declining volume during the inverted cup’s formation, and a surge in volume on the breakdown below support. This pattern is a strong signal for sellers.
Characteristics of the Bearish Inverted Pattern
The inverted cup and handle pattern features a distinctive upside-down ‘U’ shape for the cup, where the price first rises, then falls back to its starting point, followed by an upward-sloping handle. The inverted cup represents a peak in price, followed by a decline, resembling an arch. The handle, forming on the right side of the inverted cup, is a small, upward-sloping consolidation phase, often resembling a bearish flag or pennant. This handle forms below the resistance level established by the inverted cup’s rim. Volume dynamics are reversed: high volume often accompanies the initial price rise, then declines as the inverted cup forms, remaining low during the handle. A significant surge in volume on the breakdown below the support level confirms the pattern.
Trading Strategies for the Inverted Cup and Handle
- Trading the inverted cup and handle pattern involves identifying an entry point when the price breaks decisively below the support level, typically accompanied by high volume.
- The stop loss for an inverted pattern is placed just above the high of the handle, ensuring that if the price unexpectedly reverses upward, losses are limited.
- The price target is calculated by measuring the depth of the inverted cup from its highest point to the support line, then projecting that distance downward from the breakdown point.
- For example, if an inverted cup forms from $100 down to $90, the depth is $10. If the breakdown occurs at $90, the price target would be $80 ($90 – $10).
Common Mistakes and How to Avoid Them
Even with a seemingly robust pattern like the cup and handle, beginners frequently encounter failures. The cup and handle pattern has a success rate of approximately 65-70% when properly identified and traded, with variations across different markets and timeframes, implying a significant failure rate, especially for novices. Many users repeatedly ask, “Why does my cup and handle pattern fail?” This section addresses these critical pitfalls, which often stem from incorrect identification, ignoring crucial confirmation signals, and neglecting sound risk management principles.
Misidentifying the Pattern’s Components
One of the most frequent reasons for failure is the misidentification of the cup and handle pattern’s components. Beginners often mistake ‘V’-shaped bottoms for valid cups, which are inherently less reliable than the smooth, rounded ‘U’ shape. A ‘V’ shape suggests a rapid, unsustainable reversal rather than a healthy consolidation. Additionally, handles that are too deep (dropping more than 50% of the cup’s depth) or handles that slope upwards instead of downwards (for a bullish pattern) are often misidentified. These incorrect formations lack the underlying market dynamics that give the true pattern its predictive power, leading to false signals and failed trades. Accurate visual recognition is the first line of defense against these errors.
Ignoring Crucial Volume Confirmation
Another significant pitfall is ignoring the crucial role of volume in confirming the cup and handle pattern. Many beginners focus solely on the price action, overlooking the vital clues that volume provides. A valid cup and handle requires declining volume during the cup’s formation, light volume during the handle’s consolidation, and a decisive surge in volume upon the breakout. When a breakout occurs on low or average volume, it often signals a lack of conviction from institutional buyers and can lead to a “false breakout.” These false breakouts lure traders into positions that quickly reverse, resulting in losses. Always cross-reference price action with volume to validate the pattern’s strength.
Neglecting Robust Risk Management
Poor risk management is arguably the leading cause of trading failures, even with a correctly identified cup and handle pattern. Beginners often fail to implement a clear stop loss, risk too much capital on a single trade, or allow emotions to dictate their decisions. The Psychology of Trading plays a significant role here; fear of missing out (FOMO) can lead to entering trades without proper confirmation, while greed can prevent traders from taking profits or adhering to stop-loss levels. Without a predetermined stop loss, a trade that moves against the anticipated direction can quickly wipe out a substantial portion of capital.
Turn Knowledge into Profit
You've done the reading, now it's time to act. The best way to learn is by doing. Open a free, no-risk demo account and practice your strategy with virtual funds today.
Open a Free Demo AccountAdvanced Confirmation Techniques & Statistical Success Rates
While basic identification and volume analysis are foundational, combining the cup and handle pattern with other technical indicators and understanding its statistical probabilities significantly enhances trading accuracy. Most guides are introductory, focusing on primary confirmation. However, delving into secondary indicators and empirical success rates, along with the influence of market sentiment, provides a more sophisticated and realistic approach to trading this pattern. This offers unique depth and establishes advanced E-E-A-T for traders seeking an edge.
Integrating Secondary Confirmation Indicators
To further improve the reliability of the cup and handle pattern, traders can integrate several confirmation indicators beyond basic volume. Momentum oscillators like the Relative Strength Index (RSI) or the Moving Average Convergence Divergence (MACD) can confirm the underlying strength of the trend. For instance, a rising RSI or MACD crossing above its signal line as the price breaks out from the handle provides additional bullish confirmation. Moving Averages can also serve as dynamic support levels during the handle’s formation or as confirmation of the overall trend. For example, if the price breaks out above the 50-day and 200-day moving averages, it reinforces the bullish signal. These secondary indicators provide confluence, reducing the likelihood of false signals and increasing the probability of a successful trade.
Understanding Historical Success Rates and Market Sentiment
Understanding the historical success rates of the cup and handle pattern provides realistic expectations for traders. The pattern has a success rate of approximately 65-70% when properly identified and traded, though this varies across different markets and timeframes. This statistic highlights that while reliable, the pattern is not infallible, and a significant portion of trades may still fail. Furthermore, Market Sentiment plays a crucial, often overlooked, role. A bullish pattern forming in an overall bearish or highly uncertain market environment may have a lower success rate than one forming in a strong, trending bull market. Algorithmic Trading systems are increasingly designed to identify these patterns faster and with greater precision, leveraging historical data to calculate probabilities. Traders should consider the broader market context and prevailing sentiment to gauge the pattern’s potential strength.
Bottom Line
The cup and handle pattern is a powerful bullish continuation signal in technical analysis, first introduced by William J. O’Neil. Its accurate identification relies on a rounded, ‘U’-shaped cup and a shallow, downward-sloping handle, both confirmed by specific volume dynamics. While offering significant profit potential, successful trading requires precise entry and exit points, robust stop-loss placement for risk management, and an understanding of its inverted, bearish counterpart. Beginners often fail due to misidentification, neglecting volume, and poor risk control, underscoring the importance of comprehensive pattern analysis and disciplined execution. Integrating advanced confirmation indicators and understanding historical success rates, alongside market sentiment, can further improve trading accuracy and lead to more consistent profitability.
Key Takeaways
- The cup and handle is a bullish continuation pattern characterized by a U-shaped cup and a shallow, downward-sloping handle.
- Volume dynamics are critical for confirmation, showing declining volume during cup formation and a significant surge upon breakout.
- Successful trading requires precise entry, exit, and stop-loss strategies, along with an understanding of the inverted cup and handle.
- Avoid common pitfalls such as misidentifying components, neglecting volume confirmation, and poor risk management.
- Integrate secondary technical indicators and market sentiment analysis to enhance pattern reliability and trading accuracy.