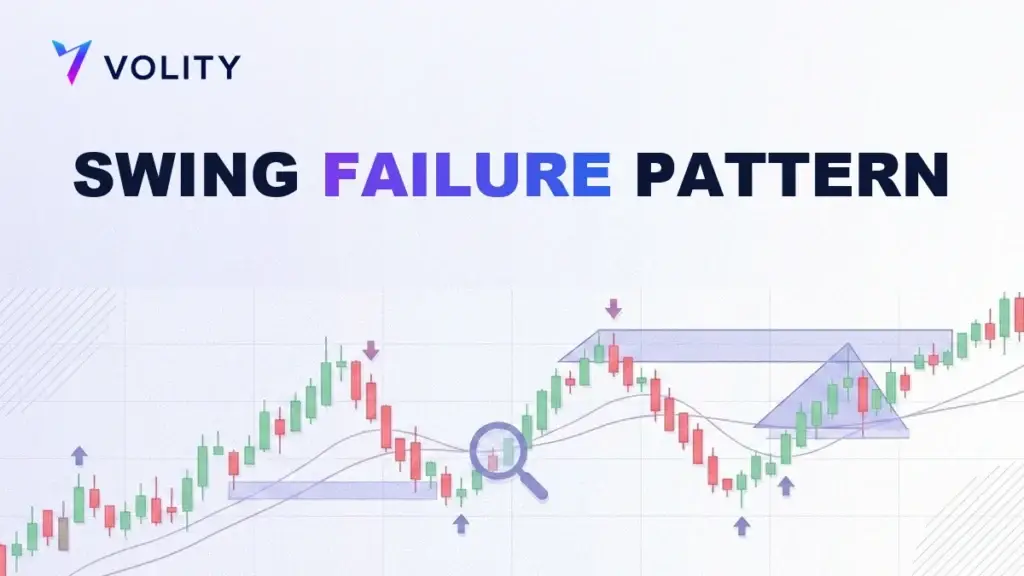
A swing failure pattern, or SFP, is a false breakout that reverses. Price briefly pushes beyond a prior swing high or low, sweeps the stop-loss orders resting there, then fails to hold and closes back inside the range. That failed break traps breakout traders and signals a reversal the other way, which is why the SFP is a favourite among price-action traders.
What is a swing failure pattern?
A swing failure pattern forms around an obvious swing point, a prior high or low that plenty of traders can see. Price runs to that level and pokes just beyond it, which looks at first like a breakout. Instead of following through, it snaps back and closes on the wrong side of the level, leaving a long wick where the failed break took place. The break failed, and that is where the name comes from.
The SFP is a close cousin of the false breakout and the liquidity sweep. What makes it a distinct, tradable pattern is the exact structure: a clean sweep of a known swing point, then a decisive close back inside the range. That single-candle rejection is the signature. It shows up on any market and any timeframe, from a four-hour crypto chart to a daily currency pair.

How does a swing failure pattern work?
To read the SFP you have to think about where orders sit. Just above an obvious swing high rests a cluster of stop-loss orders from short sellers, plus the buy orders of breakout traders. Together they form a pool of buy-side liquidity. Large participants who need to sell in size have to find buyers to sell into, and that pool is exactly where the buyers are.
So price gets driven up through the swing high, tripping those stops and the breakout traders buying the move. The push fills large sell orders into all that fresh buying, then rolls over. When price closes back below the high, the breakout buyers are trapped in losing longs and have to sell to get out, which pours fuel on the reversal. The mirror image plays out at a swing low, where sell-side liquidity is swept before price turns up, a move swing traders learn to fade. This is why some people call the SFP a controlled stop hunt, one of the moves that smart money concepts map out.
Bullish vs bearish swing failure pattern
There are two versions, one at each end of a move. They are mirror images, so learn one and you have the other.
| Feature | Bearish SFP | Bullish SFP |
| Location | At a swing high | At a swing low |
| The sweep | Wick above the prior high | Wick below the prior low |
| Liquidity taken | Buy-side liquidity | Sell-side liquidity |
| The close | Back below the prior high | Back above the prior low |
| Signal | Reversal down | Reversal up |
The close is what matters in both. A wick beyond the level does nothing on its own; price has to close back inside the range to prove the break has genuinely failed. A candle that pokes through and then closes on the far side of the level is a real breakout, not an SFP, and trading it as a reversal is how people get run over.
How do you trade a swing failure pattern?
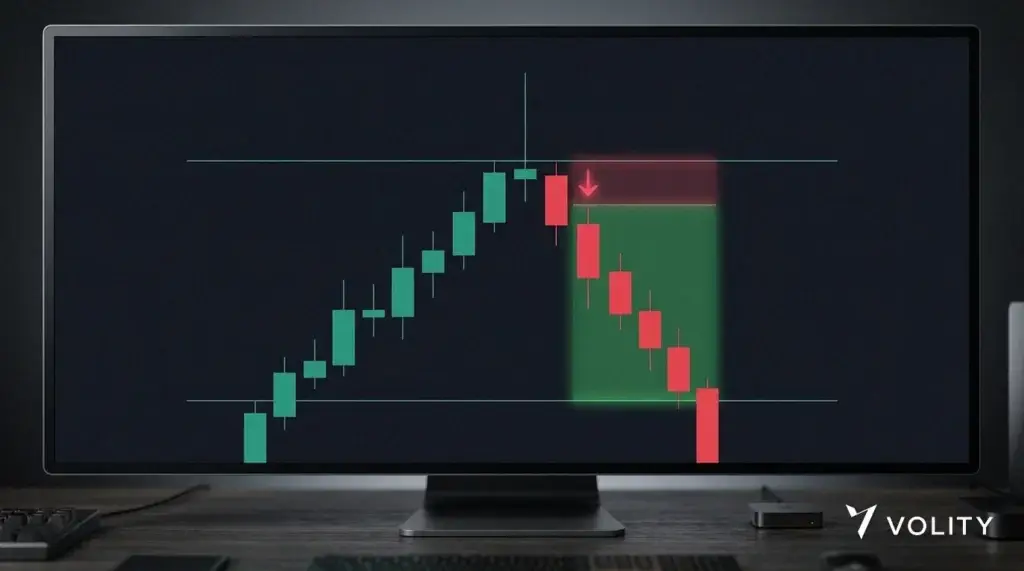
The SFP hands you a precise entry and a natural place to hide the stop, which is a big part of the appeal. Here is a disciplined routine for a bearish SFP; flip it for a bullish one.
- Mark an obvious swing high, the kind of level many traders watch and where stop orders pool.
- Wait for price to wick above the high and then close back below it. The close is your trigger, the poke on its own is not.
- Enter as the SFP candle closes, or wait for a small pullback toward the swept level and sell the rejection there.
- Put the stop just above the wick. The high of the sweep is the invalidation point, so if price trades back above it the pattern has failed and you are out.
- Target the opposite side of the range. Aim for the nearest swing low first, and trail the rest if a larger reversal starts to build.
The risk-to-reward tends to be generous because the stop can sit tight, just above the wick, while the target is the far side of the range. That geometry is the main reason traders hunt for clean swing failure patterns instead of chasing breakouts into thin air.
What makes a swing failure pattern more reliable?
Not every wick past a level is a tradable SFP. A handful of filters separate the good setups from the noise. The first is the timeframe. An SFP on the four-hour or daily chart carries far more weight than one on a one-minute chart, because it sweeps liquidity that many more traders care about.
Confluence adds to the case. An SFP that lines up with a higher-timeframe support or resistance level, a round number, or a shift in market structure is more likely to hold. A strong rejection with real volume behind it helps too. And as always, size the position so that a single failed SFP, where price reclaims the wick and carries on, is a small planned cost rather than a hit that hurts.
Trading the swing failure pattern on Volity
The SFP is a two-way setup, so you want a platform that lets you short a failed high as easily as you buy a failed low. On Volity MT you can trade the swing failure pattern as a CFD across forex, indices, gold and crypto, where the pattern turns up often. The Volity platform gives you clean candlesticks and the drawing tools to mark swing points and catch the sweep as it happens, and because the pattern rewards patience it fits swing trading as much as faster intraday work.
Keep the stop just above the wick, size to that tight distance, and use leverage on purpose rather than at the maximum. Leverage of up to 1:500 (product-dependent) lets you size a position to your planned stop instead of your account balance, which suits a setup built on a small invalidation. It cuts both ways, though, and a break that fails can move against you as fast as a good one runs. Regulators including the FCA and ESMA restrict how leveraged CFDs are sold to retail traders for that reason, so cap the risk on each trade and let negative balance protection backstop the rest.
You can open a Volity account at no cost and rehearse the read on a demo before you commit real funds, waiting for that close back inside the range until spotting it feels automatic. Check the spread and swap for your instrument on the charges and fees page so the cost of holding a position is baked into the plan from the start.
Swing failure pattern FAQ
What is a swing failure pattern in trading?
A swing failure pattern is a false breakout where price briefly moves beyond a prior swing high or low, sweeps the stops resting there, then closes back inside the range. That failed break traps breakout traders and points to a reversal the other way.
Is an SFP the same as a liquidity sweep?
They are closely related but not identical. A liquidity sweep is the act of taking out the stops beyond a level. A swing failure pattern is the specific candlestick structure, a sweep followed by a close back inside the range, that turns the idea into a defined entry with a clear invalidation.
What timeframe works best for the swing failure pattern?
Higher timeframes tend to be more reliable. An SFP on the four-hour or daily chart sweeps liquidity that more traders are watching, so it produces stronger reversals than one on a very low timeframe, where noise throws up a lot of false signals.
Where do you put the stop on an SFP?
The stop goes just beyond the sweep wick, above the high on a bearish SFP or below the low on a bullish one. If price trades back through that wick the pattern has failed, so the tight stop keeps the risk small while the target on the far side of the range keeps the reward worth taking.