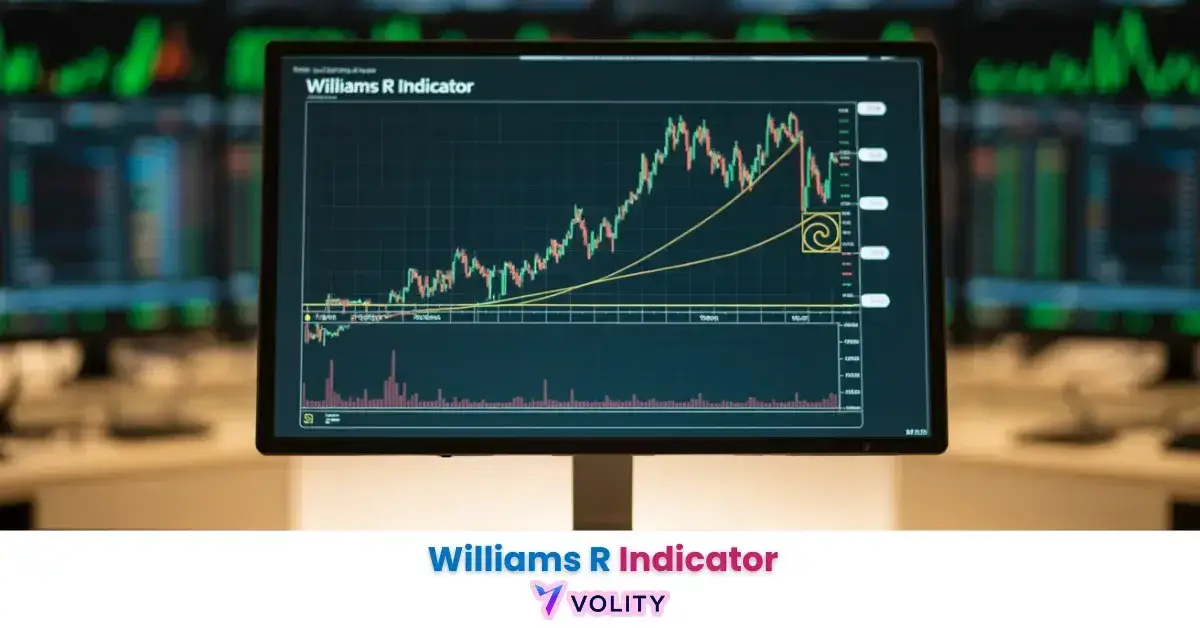
The Williams %R indicator, developed by Larry Williams, is a momentum oscillator that helps traders identify overbought and oversold conditions, oscillating between 0 and -100. It compares a security’s closing price to its high-low range, providing signals for potential price reversals. This guide moves beyond fundamental mechanics, uniquely addressing advanced false signal filtering, the impact of various market cycles, and psychological biases. By integrating these critical aspects, traders can gain a more holistic and robust approach to applying the Williams Percent Range.
While understanding Williams R Indicator is important, applying that knowledge is where the real growth happens. Create Your Free Forex Trading Account to practice with a free demo account and put your strategy to the test.
What is the Williams %R indicator?

The Williams %R indicator, developed by Larry Williams, measures overbought and oversold levels, oscillating between 0 and -100. This momentum indicator compares a security’s closing price to its high-low range over a specified period, typically 14 days. Its primary function is to help traders gauge the strength of price movements and anticipate potential reversals, making it a valuable tool in technical analysis.
The Williams %R is an oscillator designed to reveal when a stock or other asset is trading near the top or bottom of its recent high-low range. It was created by Larry Williams and is often compared to the Stochastic Oscillator due to its similar function in identifying market extremes. The indicator’s purpose is not to predict future prices but to show the current closing price’s position relative to the highest high and lowest low over a chosen time period. This helps traders assess if buying or selling pressure is becoming exhausted.
What Do the Numbers Mean?
The Williams %R scale ranges from 0 to -100. Readings closer to 0 (e.g., above -20) indicate that the price is near the high of its recent range, suggesting overbought conditions. Conversely, readings closer to -100 (e.g., below -80) signify that the price is near the low of its recent range, pointing to oversold conditions. These extreme values are crucial for generating trading signals, as they often precede potential price reversals. Intermediate readings, between -20 and -80, suggest the price is consolidating or moving within its typical range without clear overbought or oversold signals.
Understanding the Williams %R Formula
The Williams %R is calculated using a straightforward formula that compares the current closing price to the highest and lowest prices over a specific look-back period. Understanding this calculation helps traders appreciate what the indicator truly represents and how it reflects market dynamics. This understanding is essential for effectively interpreting its signals and adjusting parameters for different trading environments.
The Core Williams %R Formula
The Williams %R formula is:
%R = ((Highest High – Close) / (Highest High – Lowest Low)) * -100
Let’s break down each component of this calculation:
| Highest High | The highest price reached during the specified look-back period. |
| Lowest Low | The lowest price reached during the specified look-back period. |
| Close | The current closing price of the asset. |
For example, to calculate the Williams %R for a 14-period lookback, you would identify the highest high and lowest low over the past 14 bars, then apply the current closing price to the formula. This calculation provides a raw measure of momentum, indicating where the current close stands within its recent price spectrum. Many platforms offer a “williams r indicator formula excel” option, allowing for custom calculations and backtesting.
Sensitivity and Responsiveness
A common default period for Williams %R is 14 bars, which can be adjusted for different trading styles. This 14-period lookback provides a balanced view of short-term momentum. Shorter periods, such as 7 or 9 bars, make the indicator more sensitive to price changes, resulting in more frequent overbought and oversold signals. While this can offer earlier entry/exit points, it also increases the likelihood of false signals.
Conversely, longer periods, like 21 or 28 bars, reduce sensitivity, leading to smoother lines and fewer signals. This approach filters out some market noise but may delay entry or exit, potentially missing parts of a move. Traders should choose a time period based on their asset’s volatility and their trading strategy. For faster-moving assets or day trading, a shorter period might be preferred, while swing traders might opt for the default settings or a slightly longer period to capture broader trends.
Ready to Elevate Your Trading?
You have the information. Now, get the platform. Join thousands of successful traders who use Volity for its powerful tools, fast execution, and dedicated support.
Create Your Account in Under 3 MinutesOverbought, Oversold & Trading Signals
The primary utility of the Williams %R indicator lies in its ability to identify overbought and oversold market conditions, which are critical for generating trading signals. These signals often precede potential price reversals, offering traders opportunities to enter or exit positions strategically. Understanding the specific thresholds and nuances of these signals is vital for effective implementation.
Identifying Overbought and Oversold Zones
Readings above minus 20 are considered overbought, and readings below minus 80 are considered oversold, signaling potential reversals. When the Williams %R enters the overbought region (0 to -20), it suggests that the asset’s price is near the top of its recent range. This implies that buying pressure may be exhausted, and a price decline could be imminent. Conversely, when the indicator falls into the oversold region (-80 to -100), it indicates the price is near the bottom of its recent range, suggesting selling pressure might be waning, and a price increase could follow. These zones highlight periods of extreme price action where a shift in market sentiment is more likely to occur.
Reversals and Divergence
You use Williams %R for trading signals by observing its movement out of overbought and oversold zones. A common sell signal occurs when the indicator moves from the overbought region (above -20) back below -20. This suggests that the upward momentum is fading, and a reversal to the downside may be starting. Conversely, a buy signal is generated when the indicator moves from the oversold region (below -80) back above -80, indicating that selling pressure is easing and an upward reversal might be underway.
Williams %R can predict reversals more powerfully through divergence. Bullish divergence occurs when the price makes a lower low, but the Williams %R makes a higher low, signaling a potential upward reversal. Bearish divergence happens when the price makes a higher high, but the indicator makes a lower high, suggesting a possible downward reversal. These reversal signals, especially when confirmed by divergence, are generally considered stronger than simple overbought/oversold readings alone.
A Head-to-Head Comparison for Momentum Traders

The Williams %R and the Relative Strength Index (RSI) are both popular momentum indicators used to identify overbought and oversold conditions. While they serve similar purposes, their calculation and presentation differ, leading to subtle distinctions in their interpretation and application. Understanding these differences is crucial for traders to select the most appropriate tool for their analysis.
Key Similarities and Differences
The Relative Strength Index (RSI), developed by J. Welles Wilder Jr., measures the speed and change of price movements, oscillating between 0 and 100. Both Williams %R and RSI are leading indicators, meaning they can often signal potential reversals before they occur in price. However, their calculation methods provide different perspectives on momentum.
Here is a comparison of the two indicators:
| Calculation | Compares close to high-low range over period | Compares average gains to average losses |
| Range | 0 to -100 | 0 to 100 |
| Overbought | Above -20 | Above 70 |
| Oversold | Below -80 | Below 30 |
| Sensitivity | Often more reactive, “raw” momentum | Smoothed momentum, less erratic |
| Focus | Current close position within range | Speed and change of price movement |
| Interpretation | Stronger focus on extremes (0, -100) | Stronger focus on trend strength |
| Signal Type | Reversals, divergence | Reversals, divergence, trend confirmation |
While Williams %R typically appears more volatile, reacting sharply to price changes, the RSI indicator often provides a smoother output due to its averaging components. Traders might prefer Williams %R for quick, short-term reversal signals, especially in ranging markets. Conversely, RSI is frequently used for confirming broader trends and identifying stronger momentum shifts. Both indicators are powerful when used in conjunction with other technical analysis tools.
How to Filter False Signals & Confirmations

A common challenge for traders using the Williams %R indicator is the occurrence of false signals, which can lead to premature entries or exits and subsequent losses. To mitigate this, advanced strategies involve combining Williams %R with other technical analysis tools and robust confirmation techniques. This approach helps to filter out noise and improve the reliability of trading signals.
Confirming Signals with Other Indicators
To effectively combine Williams %R with other indicators, traders should look for trend confirmation before acting on overbought and oversold readings. Williams %R is often combined with trend-following indicators or candlestick patterns to confirm signals and reduce false positives. For instance, if Williams %R signals an oversold condition and a potential buy, a trader might wait for the price to cross above a short-term moving average, such as the 20-period Simple Moving Average (SMA), to confirm the upward momentum.
Additionally, specific candlestick patterns appearing at Williams %R extremes can provide strong validation. A bullish engulfing pattern or a hammer candlestick forming in an oversold region, combined with Williams %R moving back above -80, significantly strengthens the buy signal. Conversely, a bearish engulfing pattern or a shooting star in an overbought zone, coupled with Williams %R dropping below -20, reinforces a sell signal. Always observe raw price action for additional confirmation, making sure that the market’s behavior aligns with the indicator’s output. This layered approach helps filter out false signals and increases confidence in trading decisions.
Backtesting Your Williams %R Strategy for Optimal Performance
Backtesting is a crucial, often overlooked, step for validating any Williams %R strategy. It involves applying your chosen indicator settings and trading rules to historical price data to see how the strategy would have performed. This process allows traders to identify the strengths and weaknesses of their approach without risking real capital. By analyzing past performance, you can refine your time period settings, adjust overbought and oversold thresholds, and experiment with different confirmation indicators.
For example, a trader might backtest whether a 10-period Williams %R combined with a 50-period moving average produces better results than a 14-period setting. This systematic validation helps to build confidence in a strategy and adapt it to different market conditions. Traders often ask why their trades don’t always work; backtesting provides the data-driven answers needed to optimize for consistent performance. It transforms theoretical knowledge into a practical, proven methodology.
Turn Knowledge into Profit
You've done the reading, now it's time to act. The best way to learn is by doing. Open a free, no-risk demo account and practice your strategy with virtual funds today.
Open a Free Demo AccountMarket Cycles & Trader Psychology with Williams %R
While the technical mechanics of the Williams %R indicator are fundamental, its successful application in real-world trading extends beyond chart patterns. A holistic approach requires understanding how market cycles affect the indicator’s effectiveness and, critically, how psychological biases can lead to misinterpretation and poor decision-making. This deeper insight is often missed in purely technical analyses.
Many beginner traders struggle due to poor risk management and emotional decision-making, often exacerbated by misinterpreting indicators like Williams %R. This highlights the critical role of factors beyond just the indicator’s reading. In trending markets, for instance, Williams %R can remain in overbought territory for extended periods during strong uptrends, or oversold during downtrends. Interpreting these prolonged extreme readings as immediate reversal signals can lead to counter-trend trades that fail.
Conversely, in ranging or sideways markets, Williams %R tends to perform exceptionally well, providing clear overbought and oversold signals that are more reliable for mean-reversion strategies. Adapting your interpretation and strategy based on the prevailing market cycles is therefore essential.
Furthermore, psychological biases significantly impact how traders use Williams %R. Confirmation bias, for example, can lead traders to only see signals that align with their existing market view, ignoring contradictory evidence. Overconfidence after a few successful trades can lead to larger, riskier positions based on a single indicator, neglecting trend confirmation or proper risk management. Fear of missing out (FOMO) can push traders to enter trades prematurely when Williams %R is still in an extreme zone, rather than waiting for a confirmed exit. Recognizing these biases and developing a disciplined trading plan that incorporates robust risk management and objective analysis, rather than emotional responses, is paramount for long-term success with any technical indicator.
Bottom Line
The Williams %R indicator is a powerful momentum oscillator for identifying overbought and oversold conditions, making it a cornerstone for many traders. Its straightforward formula and clear range from 0 to -100 offer valuable insights into potential reversal signals. However, mastering this technical indicator goes beyond basic interpretation, requiring strategic approaches to filter false signals through trend confirmation with other tools like moving average and candlestick patterns. Furthermore, understanding the impact of diverse market cycles and mitigating psychological biases are critical for consistent profitability. By integrating backtesting and a disciplined approach, traders can transform theoretical knowledge into actionable, high-probability trading decisions, truly mastering the Williams Percent Range.
Key Takeaways
- The Williams %R indicator is a momentum oscillator for identifying overbought and oversold conditions, oscillating between 0 and -100.
- It helps anticipate potential price reversals, with readings above -20 indicating overbought and below -80 indicating oversold.
- Effective use requires combining Williams %R with other indicators like moving averages or candlestick patterns to filter false signals.
- Understanding market cycles and managing psychological biases are crucial for accurate interpretation and consistent profitability.
- Backtesting strategies with Williams %R is essential to optimize settings and confirm reliability across different market conditions.