The NAS100 is a contract for difference that tracks the Nasdaq 100, the index of the 100 largest non-financial companies listed on the Nasdaq exchange. Trading the NAS100 CFD lets you go long or short on the biggest United States technology names in one position on Volity MT, without owning any shares.

What is the NAS100?
NAS100 is the common CFD ticker for the Nasdaq 100 index. Some platforms label it US100 or USTEC, and Volity lists it as US100, but the three names all point to the same underlying index. The Nasdaq 100 is a modified capitalisation weighted index of the 100 largest non-financial companies on the Nasdaq, compiled by Nasdaq and reconstituted each December with quarterly rebalancing in between. If you are new to the idea, our explainer on what a stock index is covers the basics before you trade one.
Two features define the NAS100. It excludes financial companies, which sets it apart from broader benchmarks, and it is dominated by large technology and growth companies, so it tends to move more sharply than a diversified index. That higher volatility is exactly why active traders follow it. Do not confuse the Nasdaq 100 with the Nasdaq Composite, which holds more than 3,000 listings; the NAS100 tracks only the top 100.
Which companies drive the Nasdaq 100?
Because the index is capitalisation weighted, a small group of mega-cap companies carries most of its movement. The largest members are usually the names below.
| Company | Sector | Role in the index |
| Apple | Consumer technology | One of the two largest weights |
| Microsoft | Software and cloud | Core large-cap anchor |
| Nvidia | Semiconductors | Swings the index on AI demand news |
| Amazon | E-commerce and cloud | Consumer and cloud exposure |
| Alphabet | Internet and advertising | Two share classes both included |
| Meta Platforms | Social and advertising | High-beta advertising exposure |
| Broadcom | Semiconductors | Second major chip weight |
| Tesla | Automotive and energy | Adds volatility to the top of the index |
The concentration cuts both ways. A strong earnings report or an AI headline from one or two chipmakers can lift the whole NAS100, and a single weak guidance can drag it lower even when most members hold steady. Reading the index therefore means watching its heaviest constituents, not only the headline number.
How does a NAS100 CFD work, and how is it different from Nasdaq 100 futures?
A NAS100 CFD is an agreement to exchange the difference in the index price between opening and closing your position, so you trade the price move directly. A contract for difference is not the same as buying the 100 shares or an exchange traded fund, and it is not the same as holding Nasdaq 100 futures, which are standardised exchange contracts with fixed sizes and expiry dates. The CFD has no expiry to roll and can be sized flexibly, which is what makes it workable for smaller accounts.
- You can go long or short, so you can aim to profit whether the index rises or falls, and a short position needs no stock borrowing.
- You post margin rather than the full contract value, which is where leverage comes in. Volity offers leverage of up to 1:500 depending on the instrument, and because it magnifies losses as much as gains it demands disciplined sizing.
- You own nothing directly. There are no shares to hold and no expiry to roll, and when constituents pay dividends the CFD applies a dividend adjustment instead.
Volity offers the NAS100 as a CFD, listed as US100, so you can trade index CFDs on Volity alongside forex, commodities and crypto in one account, with CySEC-regulated execution under UBK Markets (licence 186/12).
How do you size a NAS100 position?
A trader searching for a nas100 lot size calculator or a nas100 position size calculator is really asking one question: how large should this trade be so that a stop-loss only risks a set amount of my account? You can work it out in three steps without any special tool, and the order ticket confirms the margin before you commit.
- Decide the cash you are willing to lose on the trade, for example 1% of your balance.
- Measure your stop distance, the gap in index points between your entry and your stop-loss level.
- Divide that cash risk by the point value of the contract multiplied by the stop distance. A wider stop means a smaller position for the same risk.
Because the NAS100 moves quickly, this kind of position sizing matters more here than on a calmer index. Volity MT displays the exact margin required for your chosen size on the order ticket, so the capital at stake is never a guess. For the wider picture, our guide to how to trade indices walks through the same discipline across the major benchmarks.
When can you trade the NAS100, and what does it cost?
The Nasdaq 100 constituents trade during the United States cash session, 09:30 to 16:00 New York time, which is when the index is most liquid and its spread tightest. The NAS100 CFD tracks the index across the trading week and commonly quotes for extended hours around that session, so you can trade the reaction to after-hours earnings before the cash market reopens.
The costs are the spread quoted in index points, an overnight financing charge on positions held past the daily rollover, and a dividend adjustment when constituents pay dividends, which credits longs and debits shorts. Funding in a currency other than the quote currency involves a 1% conversion. Full pricing sits on the charges and fees page.
How do you analyse the NAS100 instead of chasing a forecast?
No one can hand you a reliable nasdaq 100 forecast today, and a fixed “buy or sell today” call ages badly. What lasts is a repeatable way to read the index. Sound nas100 technical analysis pairs a few durable tools with the drivers behind the latest nas100 news.
- Trend and structure come first. Mark the higher highs and lower lows, and the moving averages the market keeps respecting, so you can judge whether momentum favours longs or shorts.
- Key levels matter next. Note the prior swing highs and lows where price has reacted before, because they frame your entries, stops and targets.
- Macro drivers move the whole index. Federal Reserve interest rate expectations, inflation data and bond yields hit growth stocks hardest, so a hot inflation print often pressures the NAS100.
- Earnings and chip demand can reset it in minutes, whether that is results from a mega-cap member or a shift in AI and semiconductor demand.
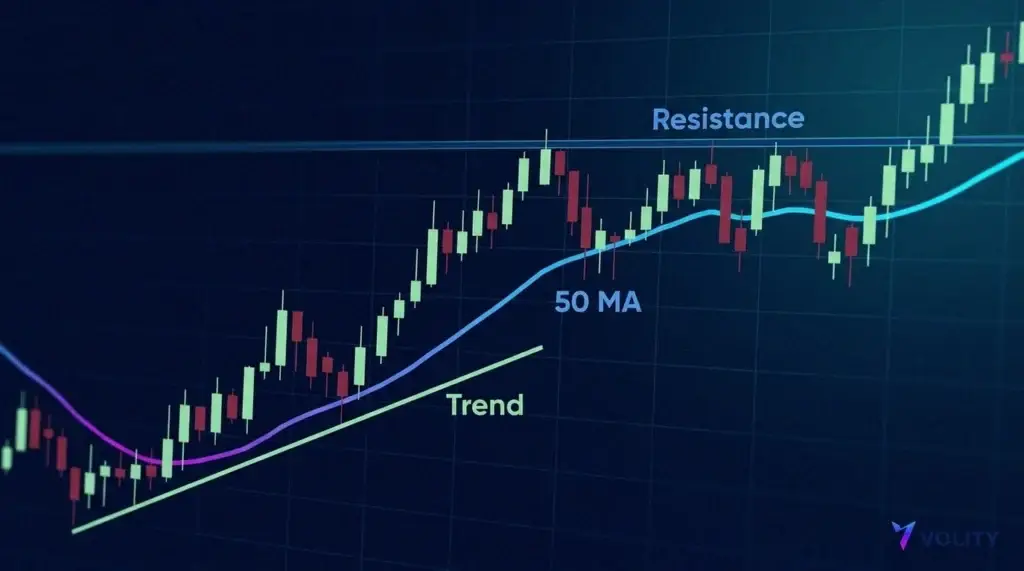
You can study all of this on the live NAS100 chart inside Volity MT, which includes TradingView charting, so you can draw levels, add indicators and read the current nas100 price against your plan. Whether to go long or short is a decision you reach from your own analysis rather than from a headline, and building that into a repeatable NAS100 strategy takes practice on the chart.
How do you manage the NAS100’s volatility?
The NAS100 is one of the faster-moving major indices. Its heavy weighting in technology and growth companies means it reacts sharply to interest rate news, earnings and shifts in risk appetite. That energy is part of the appeal, yet it works in both directions, and it is the main reason position sizing matters more here than on a calmer index. Regulators such as the ESMA and the FCA restrict how much leverage retail clients can use on CFDs for the same reason.
- Size down when the expected range is wide. The same cash risk should buy a smaller position, not a larger one.
- Use stops, and give them room. A stop set too tight is caught by ordinary noise, while a stop placed from the chart’s structure survives it and still caps the loss.
- Respect the calendar. Interest rate decisions, inflation prints and the mega-cap earnings dates are known in advance and can gap the index, so decide before the event whether you want exposure through it.
- Treat leverage with care. It magnifies the NAS100’s swings in both directions, so the faster the instrument, the more conservative the leverage should be.
None of this predicts the index. It keeps a single bad move from doing outsized damage, which is what lets a trader stay in the game long enough for an edge to play out.
Related guides
Frequently asked questions
What is the NAS100 in trading?
The NAS100 is a CFD that tracks the Nasdaq 100, the index of the 100 largest non-financial companies on the Nasdaq. It also shows as US100 or USTEC on some platforms. Trading it gives you exposure to the biggest United States technology companies in a single instrument.
Is the NAS100 the same as Nasdaq 100 futures?
They track the same index but are different products. Nasdaq 100 futures are standardised exchange contracts with fixed sizes and expiry dates. A NAS100 CFD tracks the index price, has no expiry to roll, can be sized flexibly, and trades on Volity as a contract for difference.
Should I buy or sell the Nasdaq 100 today?
That decision is yours to make from your own analysis and risk tolerance, not from a fixed signal. Read the trend and key levels on the chart, weigh the current drivers such as interest rate expectations and mega-cap earnings, then define your entry, stop-loss and target before you trade.
How do I calculate my NAS100 lot size?
Set the cash you are willing to risk, measure your stop distance in index points, then divide your cash risk by the point value multiplied by the stop distance. A wider stop means a smaller position for the same risk. Volity MT shows the exact margin for your size on the order ticket.