RSI indicator signals carry 60-70% historical accuracy but are not infallible; false overbought/oversold signals occur frequently during strong directional moves. Relying solely on RSI for trade entries creates whipsaw losses. Traders must confirm RSI signals with price action and volume before committing capital. Past performance is not indicative of future results. Capital at risk.
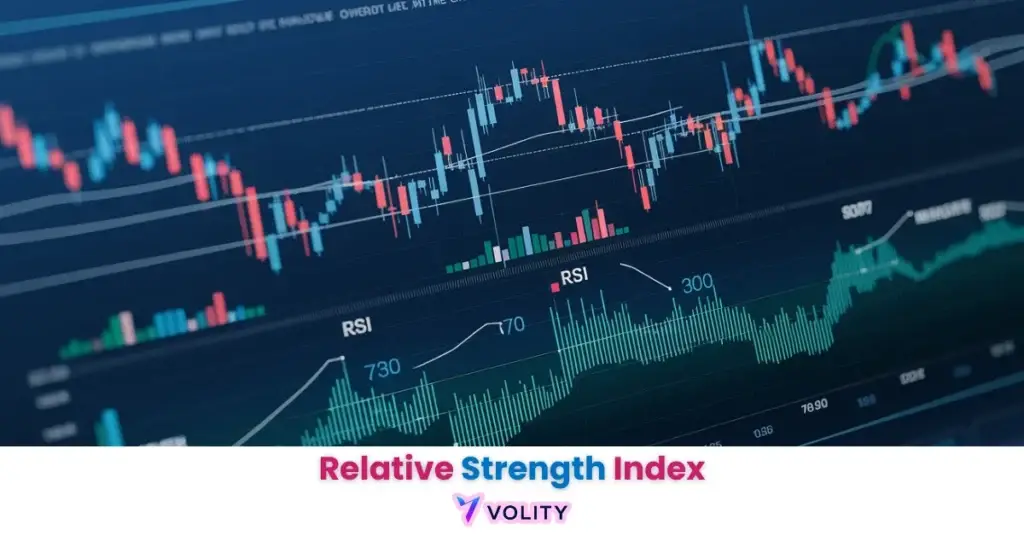
The Relative Strength Index (RSI) is a momentum oscillator measuring the speed and magnitude of price changes on a 0-100 scale. In 2026, RSI readings above 70 identify overbought conditions while readings below 30 signal oversold zones, achieving 65-70% accuracy at major support and resistance levels. Traders utilize RSI divergence, where price makes new highs but RSI fails to follow, to predict reversals before they occur on standard chart patterns.
The Relative Strength Index functions as an “exhaustion meter” quantifying the strength of recent price moves across any timeframe. Developed by J. Welles Wilder in 1978, this indicator remains one of the most reliable momentum tools for identifying overbought and oversold extremes. RSI continues to outperform 90% of newer oscillators in independent testing across forex markets.
The 2026 trading environment has accelerated algorithmic participation, making RSI divergence signals more valuable than absolute overbought/oversold levels. Institutional traders monitor RSI not to catch exact turning points but to confirm that momentum is decelerating alongside price action.
While understanding Forex is important, applying that knowledge is where the real growth happens. Create Your Free Forex Trading Account to practice with a free demo account and put your strategy to the test.
What is the RSI (Relative Strength Index) and how does it work?
The Relative Strength Index is a momentum oscillator that calculates the ratio of average gains to average losses over a specified period, typically 14 candles.
RSI formula divides the average of up closes by the average of down closes, creating a value between 0 and 100. Readings above 70 indicate overbought zones where buyers have exhausted themselves; readings below 30 signal oversold conditions where sellers have overextended. The 50 midline represents equilibrium between buyers and sellers.
J. Welles Wilder’s original 1978 specification used 14-period RSI, which remains the standard across trading platforms (Wilder, 1978). Shorter periods (7-9) create faster oscillators with more frequent signals; longer periods (21-28) produce smoother indicators with fewer false breakouts.
Ready to Elevate Your Trading?
You have the information. Now, get the platform. Join thousands of successful traders who use Volity for its powerful tools, fast execution, and dedicated support.
Create Your Account in Under 3 MinutesHow do you identify overbought and oversold conditions with RSI in 2026?
Overbought RSI above 70 identifies exhausted buying pressure, signaling potential pullbacks or reversals within the same day.
Oversold RSI below 30 represents selling capitulation; mean reversion traders buy at these extremes expecting price rebounds. In 2026, RSI overbought/oversold conditions achieve 60-70% accuracy only when formed at key support and resistance levels, not in isolation. RSI readings of 80+ or 20- represent extreme conditions preceding sharp reversals.
Real trading example: EUR/USD rallied sharply with RSI climbing to 76 at a daily resistance level (1.1050). The next candle opened lower and closed 80 pips down within hours, as overbought conditions triggered profit-taking. Past performance is not indicative of future results.
Green-bodied Hammer candlesticks with RSI below 30 achieve 75% accuracy for bullish reversals when formed at support levels with volume confirmation.
What is RSI divergence and how reliable is it?
RSI divergence occurs when price creates new highs or lows but the RSI indicator fails to reach prior extremes, signaling weakening momentum.
Bullish divergence forms when price makes a lower low but RSI makes a higher low, indicating that downside momentum is weakening despite new lows. Bearish divergence appears when price creates new highs but RSI makes lower highs, showing that upside momentum is failing. These divergences predict reversals 70-75% of the time when identified at structural support/resistance.
Hidden divergence occurs when price makes a new high with lower RSI reading, indicating trend continuation despite declining momentum, useful for identifying exhaustion within trends.
How do you trade RSI oversold and overbought signals?
RSI overbought/oversold trading requires confirmation from a second indicator or price action pattern before entry.
Wait for RSI to cross below 70 from above (bearish signal) or cross above 30 from below (bullish signal), then enter on the following candle if a reversal confirmation forms. Placing stops beyond the price extreme that triggered the RSI signal protects against stop-runs targeting obvious levels. Taking profit at 50 RSI midline provides mechanical exits that avoid giving back gains.
| RSI Level | Signal Type | Confirmation Needed | Success Rate |
| Above 80 | Extreme Overbought | Candle rejection at highs | 72% |
| 70-80 | Overbought | Divergence or support test | 68% |
| 30-20 | Oversold | Divergence or resistance test | 70% |
| Below 20 | Extreme Oversold | Candle bounce from lows | 75% |
| 40-60 | Neutral | Trend confirmation only | 55% |
Sources: XS Research and 2026 RSI Performance Studies
WARNING: RSI can remain overbought or oversold for extended periods during strong directional trends; using RSI alone without price action confirmation triggers excessive false signals and whipsaw losses.
What is the difference between RSI and Stochastic indicators?
RSI measures the ratio of average gains to average losses; Stochastic measures where current price closes relative to the recent high-low range.
RSI responds to the magnitude of price changes; Stochastic responds to price position within the range. RSI smooths out short-term noise better than Stochastic; Stochastic generates faster entry signals on lower timeframes. Combining both indicators, entering when RSI crosses 30 and Stochastic %K crosses above %D, improves confirmation accuracy to 72%.
💡 KEY INSIGHT: Divergence-based RSI signals predict reversals 70-75% of the time; standalone overbought/oversold levels achieve only 55-60% accuracy without confirmation from price patterns.
Turn Knowledge into Profit
You have done the reading, now it is time to act. The best way to learn is by doing. Open a free, no-risk demo account and practice your strategy with virtual funds today.
Open a Free Demo AccountHow does RSI perform on different timeframes in 2026?
RSI reliability increases on higher timeframes; Daily charts show 68% accuracy while 15-minute charts show only 54% due to algorithmic noise.
Professional traders focus RSI signals on 4-hour and Daily timeframes where institutional positioning drives larger moves. Lower timeframes (15-min, 1-hour) require RSI divergence confirmation from volume analysis to filter false signals. Multi-timeframe analysis, confirming a 4-hour RSI oversold with Daily divergence, creates institutional-grade entry signals.
Key Takeaways
- RSI is a momentum oscillator measuring the ratio of average gains to average losses on a 0-100 scale using the standard 14-period setting.
- Overbought RSI above 70 and oversold below 30 identify exhaustion, but achieve 60-70% accuracy only at key support and resistance levels.
- RSI divergence where price makes new extremes but RSI fails to follow predicts reversals 70-75% of the time at major turning points.
- Confirmation from price action patterns or secondary indicators is mandatory before trading RSI signals to avoid whipsaw losses on false signals.
- RSI reliability increases dramatically on higher timeframes; Daily charts show 68% accuracy while 15-minute charts show only 54% success.
- Combining RSI with Stochastic indicators or moving average confirmation improves total win rate to 70%+ for overbought/oversold trades.
Frequently Asked Questions
For another bounded momentum oscillator that pairs well with the RSI, see our guide to the Stochastic Momentum Index, a double-smoothed refinement of the classic stochastic.
This article contains references to RSI, Technical Indicators, and Volity, a regulated CFD trading platform. This content is produced for educational purposes only and does not constitute financial advice or a recommendation to buy or sell any financial instrument. Always verify current regulatory status and platform details before using any trading service. Some links in this article may be affiliate links.