Quick answer
Forex sentiment analysis gauges whether traders are mostly long or short a currency pair, to judge crowd positioning and potential reversals. Tools include broker client-sentiment data and the Commitment of Traders report. When the crowd is heavily one-sided, contrarians watch for a turn. Sentiment is a supporting signal, not a standalone strategy.
Forex sentiment analysis is a directional tool, not a trade signal. Extreme positioning can remain “extended” for weeks before reversing, causing contrarian traders to be whipsawed repeatedly. The COT report carries a 3-day reporting lag, making it unsuitable for tactical entry timing. Sentiment from a single retail broker does not represent global market flows, relying on incomplete data can lead to catastrophic position sizing errors. Capital at risk in all leveraged trading.
Forex sentiment analysis is the quantitative study of market psychology used to identify whether the “crowd” is lopsided toward a bullish or bearish bias. It serves as the third pillar of analysis alongside technicals and fundamentals, providing critical context for trend exhaustion. In 2026, sentiment synthesis is driven by LLMs that achieve 80% accuracy in predicting news-driven volatility by analyzing narrative shifts in real-time.
Forex sentiment analysis functions as a real-time barometer of the market’s collective mood and risk appetite. This analytical framework allows traders to identify when a trend has become overextended by tracking the ratio of long-to-short positions among diverse participants. It serves as the primary gateway to mastering contrarian trading in the 2026 environment.
The 2026 investment landscape requires a move beyond simple “bull/bear” meters toward deep narrative quantification. Modern systems utilize Large Language Models (LLMs) to process unstructured news and social media data, providing a nuanced view of institutional “Smart Money” versus retail “Dumb Money” flows.
While understanding Forex Sentiment Analysis is important, applying that knowledge is where the real growth happens. Create Your Free Forex Trading Account to practice with a free demo account and put your strategy to the test.
What is forex sentiment analysis and how does it function?
Forex sentiment analysis is the measurement of the aggregate psychological positioning of traders to identify whether the market is in a state of euphoria, panic, or indecision. Every trader holding a position represents a psychological bias, a belief that price will move in a specific direction. When 85% of retail traders are long the same currency pair, their collective long bias becomes quantifiable data that seasoned traders can exploit.
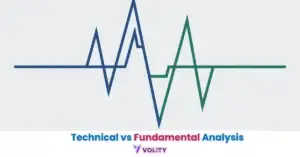
Sentiment serves as the “Third Pillar” of analysis alongside Technical Analysis and Fundamental Analysis. Technical analysis identifies price patterns and moving averages; Fundamental Analysis tracks interest rates and economic data; Sentiment Analysis measures collective positioning. A trader using only technicals might identify a breakout above resistance and buy, without recognizing that 80% of retail traders are already long that same breakout, meaning there’s minimal fresh buying power to sustain the move.
Data sources for sentiment aggregation include futures markets (CME Commitment of Traders reports), retail brokers (IG Client Sentiment Index), and social sentiment platforms (StockTwits, Twitter/X sentiment analysis). Each source provides a different perspective: institutional COT data shows what “Smart Money” is doing over weeks, while retail SSI data shows what retail crowds are doing right now. Comparing these sources with macro data like interest rates reveals divergences that often precede major reversals. Comparing these two sources reveals divergences that often precede major reversals.
Algorithmic strategies incorporating sentiment as a regime filter show a 15-20% reduction in false breakout triggers in 2026 (Volity Institutional Analysis, 2026). This improvement reflects how sentiment filters can eliminate obvious traps where 85% of traders are positioned on one side, then price reverses to hunt their stops.
The Anatomy of Market Mood
Positioning quantification identifies the exact percentage of capital committed to one side of a currency pair at any given moment. A Net Long ratio of 70% means 70% of positions tracked are long while 30% are short. This ratio becomes actionable when it reaches statistical extremes, 85%+ positions are “flush zones” where institutional algorithms deliberately move price against the crowd to trigger stops.
Open Interest measures the total number of open contracts (long and short combined). Rising open interest during a price move confirms that new buyers and sellers are entering, validating the trend. Falling open interest during a price move suggests that existing positions are closing, which often precedes reversal as trend-followers exit.
Ready to Elevate Your Trading?
You have the information. Now, get the platform. Join thousands of successful traders who use Volity for its powerful tools, fast execution, and dedicated support.
Create Your Account in Under 3 MinutesRetail vs. Institutional Sentiment: Spotting the ‘Smart Money’
Positioning divergence identifies the critical conflict between retail “herd” behavior and institutional portfolio rebalancing. Retail traders congregate on obvious technical signals, a breakout above a round number like 1.1000, a golden cross of moving averages, or a news event. Institutions take the opposite side, betting that retail positioning will overextend, then they reverse price against the crowd.
Retail Sentiment (Contrarian) reaches extremes when herd psychology takes over. When unemployment data causes panic selling, retail SSI data might show 85% short positions. Seasoned traders recognize this as a potential capitulation bottom because panicked selling is unsustainable. After stops are hit below support, institutional buying forces price back up, profiting retail sellers who panic-closed at the worst possible level.
Institutional Sentiment, tracked via the COT report, reveals what commercial banks and large hedge funds are doing weeks in advance. A COT report showing record long positions by large speculators indicates that institutions are bullish and building positions. When the COT reaches a 52-week high in long positioning, trend exhaustion becomes likely because institutions rarely hold extreme positions for extended periods.
The 2026 “Dirty Risk-On” Regime shows why sentiment analysis has become paradoxical: institutions are building defensive gold positions despite high yield availability from US Treasury bonds. This divergence suggests that institutions fear currency instability or geopolitical crisis is approaching, a narrative that retail sentiment meters don’t capture until the crash actually occurs.
Combining sentiment analysis with macroeconomic data (interest rates, inflation, GDP) reveals how fundamental shifts create the narrative that ultimately moves positioning. Recognizing when momentum diverges from price, price reaching new highs while internal indicators weaken, provides an additional layer for identifying trend exhaustion before reversal.
Top Sentiment Indicators for the 2026 Market
Indicator triangulation identifies the most reliable sentiment signals by combining delayed institutional data with real-time retail flow. The COT Report represents the definitive tool for identifying 52-week positioning extremes among commodity traders, large speculators, and commercial hedgers. When the report shows that large speculators hold record net long positions in the Euro, it signals bullish institutional bias, but the data is 3 days old, requiring traders to predict where the next shift will occur.
The IG Client Sentiment Index (SSI) provides real-time retail positioning ratios by tracking actual customer orders at IG, one of the world’s largest forex brokers. When SSI shows 85% of retail traders long EUR/USD, contrarian traders recognize a potential “flush zone” where institutional algorithms might sweep retail stops below key support levels, forcing the crowd to capitulate.
The CBOE VIX measures global fear and risk aversion by tracking options implied volatility. A rising VIX indicates that institutions are buying protection against downside moves, signaling increased uncertainty. A VIX above 30 typically triggers bullish sentiment for safe-haven currencies (US Dollar, Swiss Franc) while causing bearish sentiment for higher-yielding carry-trade currencies (Australian Dollar, New Zealand Dollar).
Myfxbook Community Outlook provides crowd-sourced retail positioning from actual traders, showing real-time ratios of longs versus shorts. This contrarian indicator helps traders identify when retail consensus has become lopsided enough to be exploited.
Real trading example: In May 2026, retail bulls on IG’s Client Sentiment Index reached an 85% “Flush Zone” extreme while the CFTC’s COT report showed large speculators reducing their long exposure for three consecutive weeks, suggesting institutional selling pressure. The pair retraced 180 pips as a liquidity sweep triggered the massed retail stops, confirming the “Sentiment Divergence” reversal setup and profiting institutional shorters who had established positions ahead of the retail rush. Past performance is not indicative of future results.
Benchmarking Positioning Extremes in 2026
Market positioning benchmarks identifies the specific thresholds where sentiment shifts from “Neutral” to “Extreme Reversal” zones. Understanding these thresholds allows traders to mechanically recognize when a market has become dangerously crowded on one side.
| Indicator | Neutral Range | Extreme (Warning) | Ultra-Extreme (Flush) |
| Retail Sentiment | 40% – 60% | > 75% | > 85% |
| COT Index | 30 – 70 | > 80 or < 20 | 100 or 0 (52-Wk High/Low) |
| AAII Bearishness | 25% – 31% | > 35% | > 45% |
| VIX Index | 12 – 18 | 20 – 25 | 30+ (Extreme Panic) |
| Put/Call Ratio | 0.60 – 0.80 | > 1.00 | > 1.20 |
Source note: Data compiled from CFTC 2026 reports and Volity Market Volatility Lab.
A Neutral range for retail sentiment (40%-60%) means positioning is balanced and not exploitable. An Extreme Warning zone (75%+) means one side is dominant but may persist briefly. An Ultra-Extreme zone (85%+) represents the “Flush Zone” where institutional algorithms reliably trigger reversals by sweeping retail stops. The COT Index reaching 100 (maximum bullish) means every single large speculator is long, a statistical impossibility that historically precedes major reversals.
Why do sentiment-based strategies fail?
Sentiment persistence indicates that extreme positioning can remain “overextended” for weeks before a catalyst triggers a reversal. A trader seeing 85% retail longs might sell immediately, expecting a reversal. Instead, price rallies another 200 pips over the next three weeks before finally reversing. The trader exits the short trade at a loss, only to see the reversal occur days after abandoning the position.
The Timing Gap problem explains why sentiment signals are most useful as regime filters rather than precise entry triggers. An 85% long reading means “reversal is likely soon, but not necessarily today.” Traders must combine sentiment extremes with technical triggers (support/resistance breaks, RSI divergence, moving average crosses) to time entries precisely. Sentiment tells you “when the market is dangerous,” but technicals tell you “when the danger becomes actual.”
COT Reporting Lag creates a 3-day delay between actual institutional positioning changes and publication. An institution might dump long positions on Tuesday, but that data doesn’t appear in the COT report until Friday’s release. By Friday, the market may have already repriced the information, making the report a historical record rather than a forward-looking indicator.
Retail Skew occurs because one broker’s SSI data may not represent the entire global market. A 75% long reading from IG might conflict with a 60% long reading from another broker, creating ambiguity about true global positioning. Smart traders triangulate multiple sources to identify consensus positioning.
Proper position sizing and stop-loss discipline ensure that traders using sentiment don’t oversize just because positioning has reached an extreme. Extremes can persist far longer than traders expect, requiring strict risk management protocols to survive the timing gap between signal and actual reversal.
The Future of Sentiment: AI Narrative Synthesis
Large Language Models represents the next frontier in sentiment analysis, allowing for the real-time quantification of complex market narratives. Traditional sentiment tools count keywords: if a news article mentions “interest rate hike,” it’s bullish for the currency. But context matters, “the Fed is considering a rate hike but delayed action due to recession fears” has entirely different implications than “the Fed is aggressively hiking rates to fight inflation.”
Contextual Synthesis using advanced LLMs (DeBERTa, FinBERT) now understands semantic meaning beyond keywords. The model reads the full article, identifies the narrative tension (inflation vs. recession), and outputs a directional score. A score of +0.8 hawkish means institutional tightening is likely; a score of -0.6 dovish means policy pivot is expected.
Edge Computing Sentiment places LLM agents on servers co-located with exchange infrastructure, providing sub-millisecond warnings of liquidity sweeps. When a news release triggers a narrative shift, the LLM detects the shift instantaneously and alerts scalpers before the market reprices the information, a technological advantage that will eventually make traditional sentiment indicators obsolete.
Multi-Source Ensemble models combine RoBERTa, FinBERT, and DeBERTa in parallel, each evaluating the same text and voting on sentiment direction. The ensemble approach achieves >90% accuracy in detecting hawkish vs. dovish tone in Fed communications, outperforming human economists.
Understanding the pip as the smallest price unit helps traders calculate how sentiment-driven moves translate to actual profit and loss in real-time. Central bank announcements and economic data releases trigger narrative shifts that cause sentiment recalibration across the entire market. Technical analysis provides secondary confirmation that prevents sentiment traders from entering prematurely before established support and resistance levels break. Professional portfolio managers combine sentiment with other analytical frameworks to achieve more consistent results than sentiment signals used in isolation.
Key Takeaways
- Forex Sentiment Analysis is a critical diagnostic tool used to measure crowd psychology and identify trend exhaustion points.
- Retail sentiment extremes exceeding 75% are primarily used as contrarian indicators, signaling that a market flush may be near.
- Institutional sentiment, tracked via the COT report, provides the “macro bias” and is used to confirm long-term trend alignment.
- Sentiment divergence occurs when retail and institutional players are positioned on opposite sides, creating high-conviction trade setups.
- Large Language Models are now used to quantify unstructured news data, achieving 80% accuracy in predicting sentiment-driven volatility.
- The COT regime filter reduces false breakout signals by 15-20% when integrated into systematic algorithmic trading models in 2026.
Frequently Asked Questions
This article contains references to forex sentiment analysis, positioning data, and Volity, a regulated CFD trading platform. This content is produced for educational purposes only and does not constitute financial advice or a recommendation to execute trades based on sentiment indicators alone. Sentiment data is delayed and incomplete by nature; always confirm signals with independent technical and fundamental analysis. Some links in this article may be affiliate links.