You have a trading idea that looks brilliant on a live chart, but no idea whether it actually makes money or just feels like it should. Backtesting is how you find out before you risk a cent. You apply your exact entry, exit and risk rules to old price data and measure how they would have performed. This guide shows you how to run a clean backtest by hand, read the four numbers that matter, and prove the idea on a free demo before you go live.
TL;DR / Quick insight: To backtest a strategy, write your idea as mechanical rules (entry, exit, stop, position size), replay historical price one bar at a time while hiding the future, log every trade, then compute win rate, average R, max drawdown and expectancy. A positive backtest is a hypothesis, not a promise. Real spreads and slippage eat into paper results. The safe path runs backtest, then forward-test on a free demo, then go live small.
You do not need a paid tool. A price chart, a bar-replay function and a spreadsheet are enough to backtest any strategy for free. A backtest rehearses your rules against the past. It estimates whether your strategy had an edge, but it does not predict the future.
What backtesting is, and what it cannot tell you
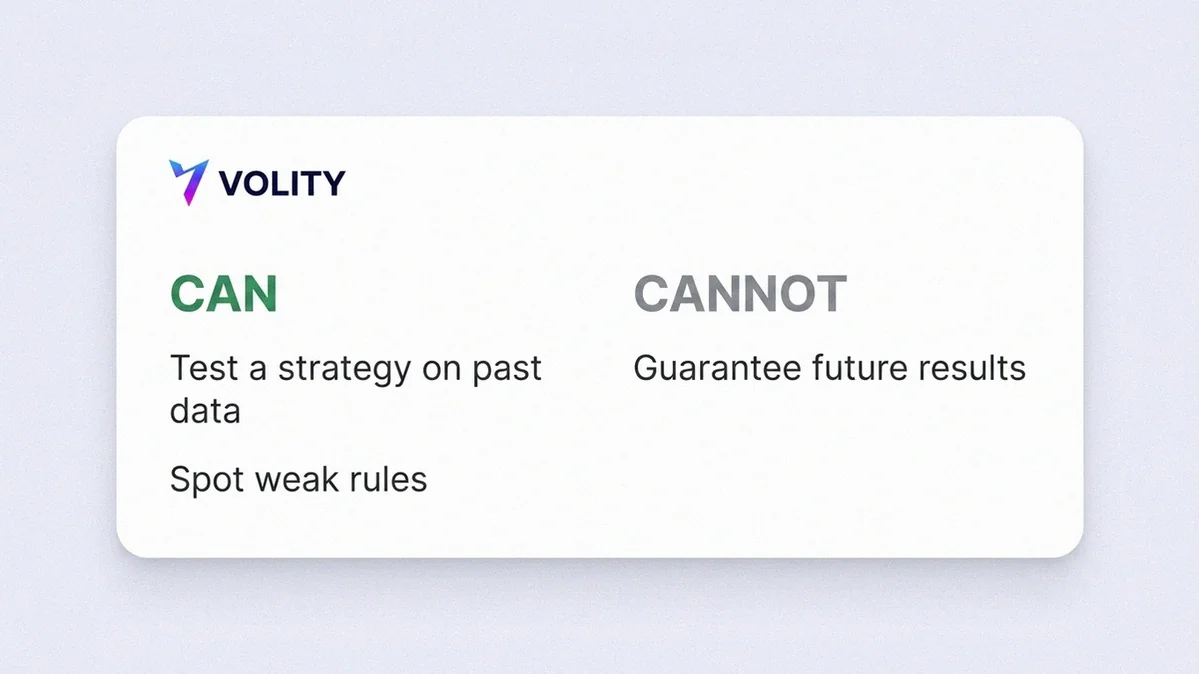
Backtesting takes fixed rules – buy here, sell there, stop here – and applies them to historical price data to see how they would have performed. It gives you evidence, not certainty.
What it cannot tell you matters just as much. Past performance is not future results. Real costs bite. Live trading carries spreads (the gap between buy and sell price), commissions and slippage (when your order fills at a worse price than expected), so a test that ignores them flatters itself. Rules tuned for a calm market can also fall apart in a choppy one.
Before you start, write one honest sentence on what your backtest will prove (an edge on this market) and what it will not (that the future repeats).
Define rules you can actually test
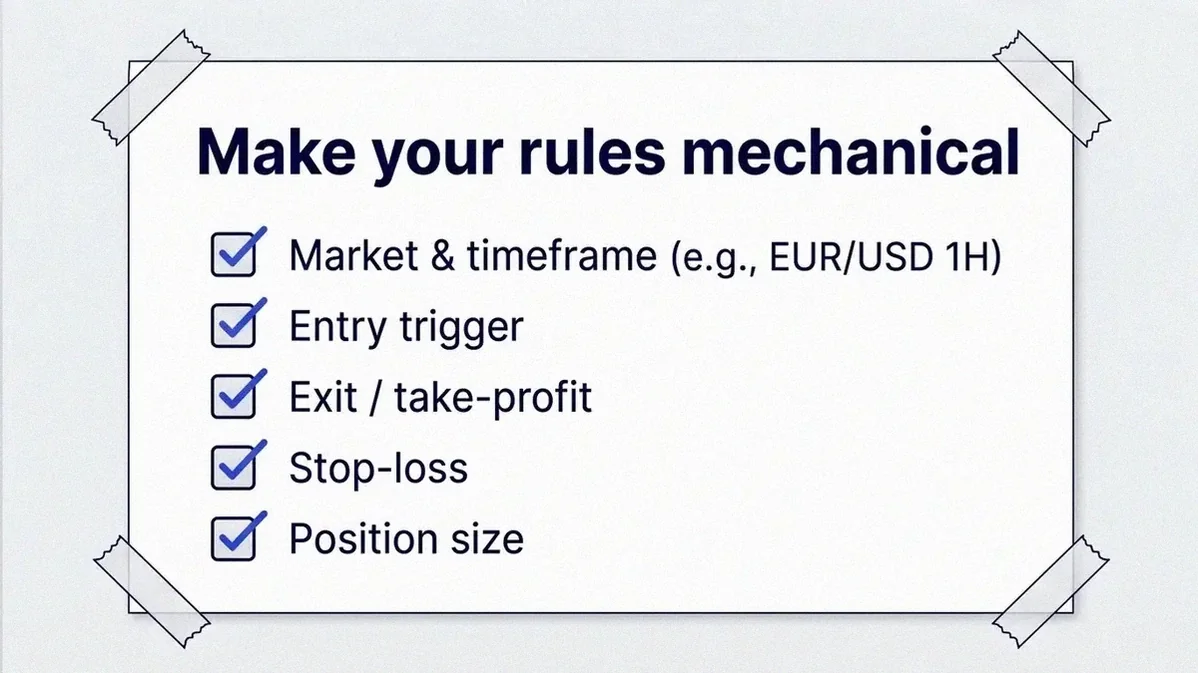
A backtest is only as good as its rules. “Buy when it looks strong” cannot be tested, because two people would mark different trades. You need rules so mechanical that a stranger could produce the same trades. Pin down five things:
- Market and timeframe – what you trade and on which candles, for example EUR/USD on the 1-hour chart.
- Entry trigger – the precise condition that puts you in.
- Exit or take-profit – where you close a winner.
- Stop-loss – where you get out for a loss; this defines your risk per trade.
- Position size – how much you risk per trade, ideally a fixed % of the account.
Write your strategy as a rule sheet a stranger could execute with no guessing. “I’d probably…” is not a rule yet.
Backtest by hand, step by step
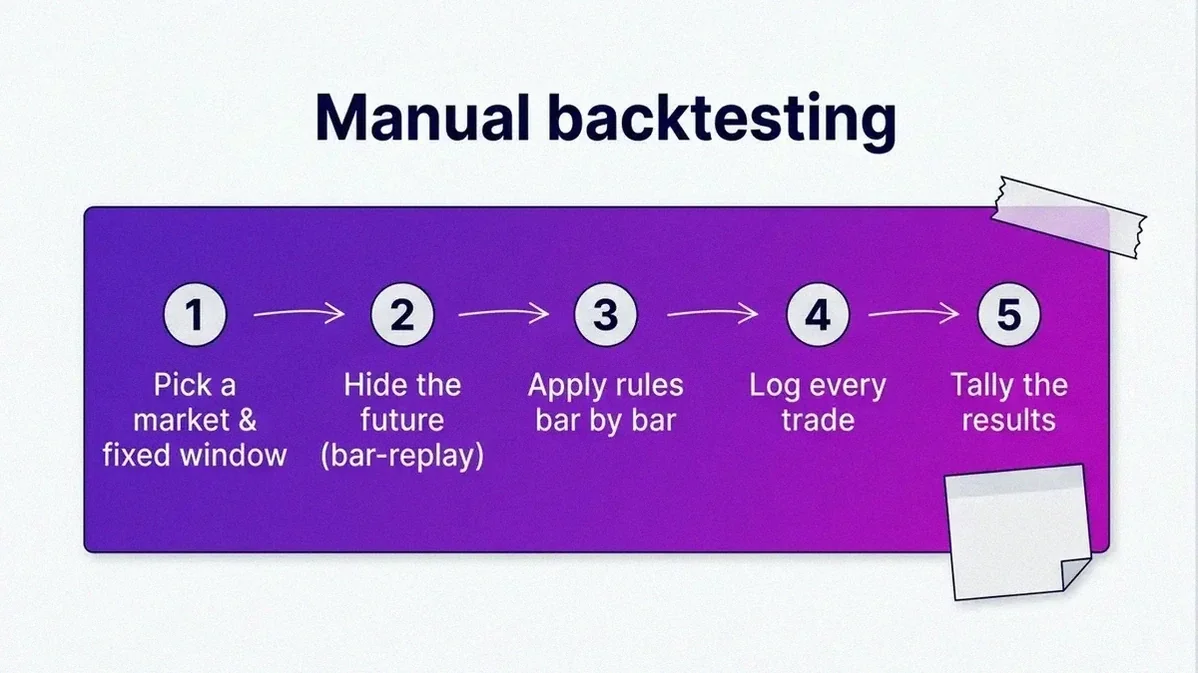
Manual backtesting is slow, but doing it by hand trains your eye to spot setups in real time. The trade counts below are illustrative.
- Pick a market and a fixed historical window – one instrument and a defined stretch of past data, fixed upfront so you cannot cherry-pick.
- Hide the future. Use your chart’s bar-replay mode, which reveals price one candle at a time. This step matters most. Skip it and you will cheat.
- Scroll one bar at a time and watch for your entry condition.
- When a signal appears, log the trade – entry, stop, planned exit – before you reveal the outcome.
- Reveal the result and record the R. Move forward until the trade hits the stop or the exit, then note the win or loss and the R-multiple (how many times your risk you made or lost).
- Repeat across the sample (30-50 trades is a reasonable illustrative start) so luck cannot fool you.
Log every trade, winners and losers, in a journal. Do not skip losers or round near-misses up.
Compute the metrics that matter
Four numbers turn your journal into a verdict:
- Win rate – the share of trades that won. 6 of 10 is 60%. A high win rate alone is not profit; small wins and big losses can still sink you.
- Average R (reward-to-risk) – your average result in units of risk. Risk $100 to make $200 and a win is +2R, a loss -1R.
- Max drawdown – the largest peak-to-trough drop in your account during the test. It shows whether you could stomach the strategy.
- Expectancy – average profit per trade, (win% x average win) – (loss% x average loss). Positive means an edge; negative means the rules lost money.
Illustrative worked example (made-up numbers, not a claim):
50 trades, 40% win rate, average win +2R, average loss -1R, risk $100.
Expectancy = (0.40 x $200) – (0.60 x $100) = +$20 per trade.
Even with most trades losing, positive expectancy means an edge. These figures are illustrative only.
Compute all four and write one verdict – “positive edge” or “no edge” – based on expectancy. If it comes out negative, question the strategy, not the settings.
Avoid the two mistakes that wreck backtests
Two errors ruin more backtests than bad strategies do.
The first is overfitting: you adjust your rules until they fit one slice of history perfectly. The past looks flawless, but you have just memorised noise, and the strategy collapses on fresh data.
The second is look-ahead bias: you use information you would not have had in real time, like acting on a candle’s close before it closed. It makes paper results impossibly good, which is the reason you hide the future.
Two smaller traps remain: samples too small to mean anything, and ignoring costs. The guardrail is out-of-sample testing (walk-forward). You reserve data you never looked at, then run the finished strategy on it cold.
Re-run the strategy on a fresh out-of-sample window. If it falls apart, trust the cold result.
Move from backtest to demo to live
A positive backtest is a hypothesis, not a green light. The bridge to real money is forward-testing, where you run the same rules in live conditions without risking capital. A demo is a practice account that trades live prices with virtual money, so you feel real spreads, fills and timing at zero risk. Volity offers a free demo on every account tier. Real costs matter, so it helps that the Markets account is commission-free and Standard spreads start from 0.6 pip (a pip is the smallest standard price move in forex). SEE FEES AND ACCOUNT TYPES to factor them in.
Safe sequence:
Backtest → Out-of-sample re-run → Forward-test on a free demo (live conditions, no risk) → Go live small
TRY A FREE DEMO ACCOUNT, forward-test the same rules, and scale into live trading in small size only once it holds up. One Volity login covers shares, fractional shares, crypto and CFDs; if forex is your focus, the forex hub has the matching guides.
Run through the clean-backtest checklist
Before you trust a strategy with real money, tick every box. One unchecked box means you are guessing.
- Rules written as mechanical if-this-then-that (entry, exit, stop, size), zero discretion.
- A fixed window chosen before testing, not cherry-picked after.
- The future hidden during the test (bar-replay, no peeking).
- Real costs included: spreads, commissions and slippage.
- An adequate sample, large enough that luck does not drive it.
- All four metrics computed: win rate, average R, max drawdown, expectancy.
- An out-of-sample re-run on data you never optimised.
- Forward-tested on a free demo before real capital.
Keep this checklist beside your journal and refuse to fund a strategy that misses a box.
Ready to put a validated strategy to work? You can OPEN A VOLITY ACCOUNT and trade forex, shares, crypto and CFDs from one commission-free login. The trader education hub has the risk and journaling guides that make a backtest pay off.
Reviewed by: the Volity editorial desk (A. Bennett byline).
Data integrity: all formulas (expectancy, R-multiple, drawdown) are standard trading mathematics; every numeric example is labelled illustrative, not a forecast. Volity product facts (free demo on every tier, commission-free Markets account, spreads from 0.6 pip) are verified against Volity’s published account and fee docs, June 2026.
Related Volity guides
Related coverage on Volity
- How to Size a Trade: Position Sizing and Risk Per Trade for Beginners
- Risk-Reward Ratio Explained: How to Set It and Why It Matters
- Demo vs Live Trading Account: A 7-Step Checklist Before You Go Live
- How to Avoid Overtrading: 8 Practical Rules
- Forex Risk Management: A Position-Sizing Framework for Pairs
Frequently asked questions
What is backtesting in trading?
Backtesting applies your fixed entry, exit and risk rules to historical price data to see how they would have performed. It estimates whether a strategy had an edge – evidence, not a guarantee.
How many trades do you need to backtest a strategy?
Enough that one lucky or unlucky streak cannot drive the result – a meaningful sample, not a handful. Any specific number is a rule of thumb; bigger samples read more reliably.
How do I backtest a forex strategy specifically?
Use the same method on a currency pair and timeframe, for example EUR/USD on the 1-hour chart: mechanical rules, candle-by-candle replay, a logged journal, the four metrics. Apply realistic spread and rollover costs, then forward-test on a demo.
Why does expectancy matter more than win rate?
Expectancy, (win% x average win) – (loss% x average loss), is the average profit per trade. A strategy can win often yet lose money if its losses dwarf its wins, so positive expectancy is the clearest sign of a real edge.
Can you backtest a strategy for free?
Yes. You only need a price chart with bar-replay and a spreadsheet to log trades and compute the metrics by hand. To forward-test in live conditions, open a free Volity demo, available on every tier.
Is backtesting reliable?
It works as an estimate of edge, not a promise. It depends on a large enough sample, an out-of-sample re-run, and including real costs. Skip those and a backtest can flatter a strategy that fails live.
Sources
The guidance above draws on the following public sources.
- Corporate Finance Institute – what backtesting is
- Corporate Finance Institute – spreads are a real trading cost
- arXiv (Avoiding Backtesting Overfitting by Covariance-Penalties) – research on backtest overfitting
- arXiv (Determining Optimal Trading Rules without Backtesting) – why tuned rules mislead
- CMT Association – professional technical analysis standards
- Nasdaq – free historical price data
- European Securities and Markets Authority – past performance is not a promise
- Financial Conduct Authority – consumer guidance on investment risk
- Investor.gov – official investor bulletins
- Federal Reserve Board (FEDS research series) – research on financial data inference