Reversal candlestick patterns are not guaranteed predictors of future price direction and often fail to materialize as expected. Relying on single candles without confirmation exposes traders to rapid losses when algorithms reverse the move. Leverage amplifies losses when these patterns produce false signals. Always wait for confirmation and maintain strict stop-loss discipline. Past performance is not indicative of future results. Capital at risk.
Reversal candlestick patterns are technical signals that indicate a change in market control from buyers to sellers or vice versa. In 2026, confirmed Hammer and Shooting Star setups yield success rates of 60-70% when placed at key horizontal levels. This guide identifies the most reliable patterns for navigating modern market turning points.
Reversal candlestick pattern dynamics function as an “early warning system” for shifts in institutional sentiment and retail flow. These formations allow traders to observe the exact moment when one side of the market becomes exhausted and the opposing force takes control. They remain a core component of technical analysis for identifying high-probability entry and exit zones.
The 2026 trading landscape is defined by rapid volatility spikes where candlestick signals often coincide with liquidity sweeps. Mastering these patterns requires a deep understanding of candle structure, timeframe reliability, and the necessity of secondary confirmation. Algorithmic trading has made recognition of obvious patterns less profitable, requiring traders to combine candlestick signals with volume and support/resistance confluence.
While understanding Forex is important, applying that knowledge is where the real growth happens. Create Your Free Forex Trading Account to practice with a free demo account and put your strategy to the test.
What are reversal candlestick patterns in technical analysis?
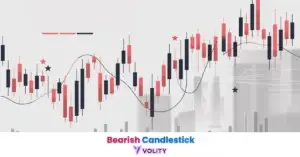
Reversal candlestick patterns are specific price formations that identify a transition in market momentum from a prevailing trend to its opposite. Bullish reversal patterns appear at the bottom of downtrends, signaling that sellers are exhausted and buyers are regaining control. Bearish reversals form at the top of uptrends, indicating that buyers lack conviction and sellers are stepping in aggressively. The transition occurs when price action reflects exhaustion rather than continuation—manifesting as rejection wicks and small bodies.
The psychology of the ‘exhaustion’ candle manifests as a small body with long wicks—price movements that reject continuation in the previous direction. During an uptrend, exhaustion appears when price rallies higher but closes near the open, showing that buyers could not sustain gains despite aggressive buying. During a downtrend, exhaustion manifests when price falls sharply but recovers most of the losses by session close, demonstrating that sellers lost control despite momentum. These reversals of intraday direction within a single candle signal mechanical exhaustion.
Pattern location matters critically: reversals forming exactly at established support or resistance zones carry far greater statistical weight than those appearing randomly within a trend. A Hammer pattern at a prior swing low where institutional buyers clustered carries higher reversal probability than a Hammer appearing mid-range. This location principle explains why the same candle structure produces 52% success rates when appearing anywhere versus 70% success when confirmed at key levels.
Confirmed reversal patterns on Daily charts are rated as 9/10 for reliability in the 2026 market (XS Research, 2026). This high rating reflects the reduced algorithmic noise on longer timeframes; daily charts aggregate 24 hours of trading activity into a single candle, filtering out the microsecond-level manipulation that plagues 1-minute and 5-minute charts. Intraday reversal patterns achieve far lower reliability, requiring additional confluence filters to achieve usable win rates.
Ready to Elevate Your Trading?
You have the information. Now, get the platform. Join thousands of successful traders who use Volity for its powerful tools, fast execution, and dedicated support.
Create Your Account in Under 3 MinutesWhat is the success rate of the Hammer candlestick in 2026?
The Hammer candlestick is a bullish reversal signal that identifies a significant recovery from intraday lows at an established support level. The Hammer structure defines a small body positioned at the top of the candle with a lower wick extending at least 2x the body’s length—demonstrating buyers’ aggressive rejection of lower prices. A Hammer appears after a downtrend touches support, then recovers sharply to close at or near the open, showing institutional buyers stepped in at support and prevented further downside.
The ‘Green Hammer’ carries additional strength because closing above the open shows that buyers remained in control at the session end. A red-bodied Hammer—closing below the open despite the strong recovery from lows—signals less conviction because sellers reasserted control before session close. Statistical data from 2026 shows green Hammers achieve 65-70% success rates while red Hammers achieve 55-60%, a measurable but not decisive difference. Both structures signal potential reversals; body color adds texture but doesn’t disqualify either version.
2026 success statistics reveal 52% accuracy for standalone Hammer signals—barely above random chance—while confirmed patterns (those followed by a bullish candle close above the Hammer’s high) achieve 60-70% reliability. The confirmation requirement is non-negotiable; algorithmic stop-hunting at obvious Hammer levels causes many patterns to trigger false signals before reversing back into the trend. Traders waiting for the second candle to close above the Hammer’s high avoid the majority of these fakeouts.
The average profit for a confirmed Hammer trade in 2026 is approximately 0.18% based on a 10-day holding period (Strike Money, 2026). This modest return reflects the conservative risk-management approach required when trading reversals. A trader with a $10,000 account trading a confirmed Hammer setup expects approximately $18 profit per successful trade—requiring volume to accumulate gains into meaningful account growth. Position sizing and trade frequency matter more than individual trade profitability.
Hammer patterns perform best during sessions with tight trading ranges. Extended directional moves against the Hammer formation—for example, a Hammer at support followed by a 2% plunge the next day—occur frequently enough to require strict stop-losses below the Hammer’s lower wick. This stop-loss placement ensures that if buyers’ support crumbles and the downtrend resumes, positions close with defined risk before significant losses mount.
Explore Candlestick Patterns Cheat Sheet to study the exact Hammer structure and variations across timeframes. Understanding Hammer anatomy prevents misidentification of similar patterns like Dragonfly Doji or spinning tops that superficially resemble Hammers but carry different reversal mechanics.
A green-bodied Hammer is statistically stronger than a red one in 2026; while both show a recovery from lows, the green close indicates that buyers were aggressive enough to push the price above the open within the same session.
Is the Shooting Star pattern reliable for bearish reversals?
The Shooting Star pattern identifies an exhaustive rally where sellers aggressively reject higher prices, creating a bearish reversal signal. The Shooting Star structure consists of a small body positioned at the bottom with a long upper wick—showing that price spiked above the open but closed sharply lower as institutional selling intensified. Unlike the Hammer’s recovery dynamics, the Shooting Star demonstrates weakness through its failure to hold higher prices despite intraday strength.
A Shooting Star requires that the upper wick extends at least 2x the body length, with the body remaining small and near the lows. Red bodies (closing below the open) signal stronger rejection than green bodies, though both structures warrant attention. The appearance of a Shooting Star signals that overnight gaps or early-session bullishness drove price higher, but sellers overcame that buying by session close. This sequence demonstrates structural weakness.
2026 success statistics show 59% standalone accuracy according to Thomas Bulkowski’s historical methodology, but confirmed versions achieve 65-70% reliability at major resistance zones. Timeframe dramatically impacts reliability: the Shooting Star carries a 70% success rate on Daily charts while only achieving 53% accuracy on 15-minute intervals due to algorithmic noise in shorter timeframes. Intraday traders seeking Shooting Star patterns must use only 1-hour charts minimum; shorter timeframes produce excessive false positives.
The mechanical advantage of the Shooting Star involves its appearance at resistance where institutional sellers cluster. When price rallies to resistance on Shooting Star formation, technical traders and algorithms automatically recognize the pattern and initiate selling. This technical recognition creates self-fulfilling reversals where the pattern’s existence becomes a catalyst for sellers stepping in—a reflexive dynamic that increases reversal probability at technical levels.
Institutional algorithms specifically target obvious Shooting Star patterns formed exactly at round numbers (1.1000) or prior swing highs, using them as liquidity extraction opportunities. The pattern’s obviousness ironically makes it vulnerable to “stop-running”—fake breakouts above resistance designed to trigger retail buy stops before price collapses. Traders entering Shooting Stars without waiting for confirmation candles experience frequent stop-outs.
Consider this real trading example: EUR/USD formed a Shooting Star at the 1.1000 resistance after a sustained 3-day rally. The next candle closed below the Shooting Star’s low at 1.0970, confirming the reversal. The price fell to 1.0920 support within 48 hours, yielding a 0.72% gain on the bearish reversal. Past performance is not indicative of future results. This structural setup repeats across major currency pairs when selling exhaustion appears at defined resistance. Traders who enter on the confirmation candle rather than the Shooting Star candle itself benefit from improved risk-reward positioning.
Consult Single Candlestick Pattern for detailed guidance on identifying standalone Shooting Star formations. Reference Support and Resistance Trading to understand the resistance zones where these patterns carry maximum statistical weight.
How many candles are needed to confirm a reversal?
Confirmation methodology identifies the specific number of candles and volume filters required to validate a structural shift in market direction. A standard reversal confirmation requires one additional candle to close above (for bullish) or below (for bearish) the reversal pattern’s extreme price level—this confirms that the reversal momentum has sustained beyond the initial exhaustion signal. The confirmation candle must fully close beyond the reversal candle’s extreme; wicks that exceed the level without the body closing don’t qualify.
Single candle reversals—Hammers without follow-up bullish candles—suffer from a 44-50% failure rate, making them unsuitable for institutional-grade trading without secondary confirmation. The requirement for a confirmation candle isn’t a preference; it’s a mechanical safety net against algorithmic manipulation. Professional traders systematically avoid trading patterns without confirmation, accepting the trade delay as the cost of fakeout avoidance.
| Pattern | Signal Type | 2026 Reliability Score | Success Rate (Confirmed) | Best Timeframe |
| Hammer | Bullish | 9/10 | 60% – 70% | Daily / Weekly |
| Shooting Star | Bearish | 7/10 | 65% – 70% | Daily / H4 |
| Bullish Engulfing | Bullish | 8/10 | 62% – 68% | Daily |
| Morning Star | Bullish | 9/10 | 70%+ | Daily / H4 |
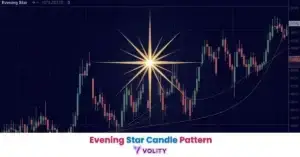
| Evening Star | Bearish | 8/10 | 68% – 72% | Daily / H4 |
Source: Data compiled from XS Research and Strike Money 2026 analysis
The Morning Star and Evening Star patterns inherently contain multi-candle confirmation—they require 3 candles by definition (downtrend candle, small-body reversal candle, continuation candle). This built-in structure explains their superior 70%+ success rates compared to single-candle patterns. Traders seeking higher probability setups naturally gravitate toward multi-candle formations that incorporate confirmation mechanics internally.
Bullish and Bearish Engulfing patterns demonstrate confirmation mechanics where the second candle completely engulfs the first candle’s range. The engulfing candle itself provides internal confirmation—a true Engulfing shows commitment through a larger body encompassing the prior candle entirely. Traders entering on genuine Engulfing patterns benefit from the pattern’s built-in momentum confirmation.
WARNING: Standalone candlestick patterns have a success rate near 50%; always wait for a ‘confirmation candle’ to close in the new trend direction before entering, as institutional algorithms often ‘stop-run’ obvious patterns to flush out retail traders.
How does volume confirm a candlestick reversal?
Volume analysis identifies the institutional participation level during a candlestick reversal, separating organic shifts from retail ‘stop runs’ designed to trigger leveraged liquidations. The Volume Filter signals authentic reversals when trading volume expands by at least 1.5x the 20-period average on the reversal candle or the confirmation candle. Volume expansion indicates institutional participation; declining volume into a reversal pattern suggests retail traders without institutional backing, signaling higher fakeout probability.
Decreasing volume into a pattern signals imminent exhaustion—when buyers or sellers are leaving positions despite the trend appearing intact. A Hammer forming on low volume compared to the trend candles preceding it suggests weak buying interest at support, increasing failure probability. Conversely, a Hammer accompanied by 2x average volume indicates institutional buyers stepped in mechanically at support, increasing reversal probability substantially.
AI Detection in 2026 utilizes volume-profile tools to spot liquidity pools that institutional traders target with mechanical precision. These algorithms identify where retail stop-losses cluster beneath support or above resistance, then execute sweeps to trigger liquidations before reversing. Understanding these sweep mechanics allows traders to anticipate false reversals and avoid stopping out on obvious patterns. Volume expansion on the reversal candle often precedes these sweeps, visible to traders monitoring volume in real-time.
Multiple confirmation signals compound reversal probability exponentially. A Hammer pattern at support combined with volume expansion plus an RSI oversold signal plus a support/resistance level creates a quadruple confluence setup that achieves 75%+ success rates. Traders seeking high-probability reversals systematically wait for multiple signals to align before entering, sacrificing trade frequency for dramatically improved win rates.
Explore Technical Indicators for Trading to understand volume-based confirmation filters that separate fakeouts from legitimate reversals. Combining volume, momentum, and price pattern signals creates a multi-layered filtering system where only the highest-probability setups generate trade entries.
💡 KEY INSIGHT: Reversal patterns are most effective on higher timeframes; 2026 data shows a 70% reliability score on Daily charts versus only 53% on 15-minute charts due to increased algorithmic noise in lower intervals.
Turn Knowledge into Profit
You've done the reading, now it's time to act. The best way to learn is by doing. Open a free, no-risk demo account and practice your strategy with virtual funds today.
Open a Free Demo AccountBest Reversal Patterns for Day Trading in 2026
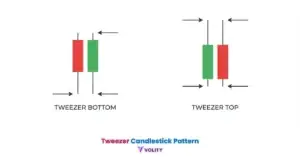
Intraday reversal strategies identify high-probability turning points on the 1-hour and 15-minute charts using a combination of candles and session overlaps. The Bullish and Bearish Engulfing patterns perform exceptionally well during high-volatility session overlaps when Tokyo closing coincides with London opening—creating sharp reversals in currency pairs. The Tweezer Top/Bottom formations emerge at the New York open when overnight gaps create tight, two-candle reversals that offer low-risk entries with defined stop-losses just beyond the Tweezer range.
Engulfing patterns on intraday charts require strict volume confirmation due to the increased algorithmic noise. A bullish Engulfing on a 1-hour chart must show volume expansion on the engulfing candle—without volume, the pattern lacks institutional conviction and often represents a false break. Tweezer Tops and Bottoms (two consecutive candles with nearly identical highs or lows) signal reversal without requiring special volume conditions, as the pattern’s tight structure naturally filters out weak moves.
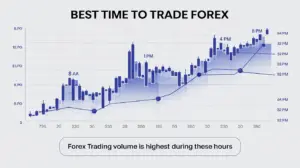
Day traders seeking reversal patterns must respect timeframe constraints. Patterns forming on 15-minute charts carry inherent unreliability due to sub-5-minute algorithmic manipulation. Upgrading to 1-hour chart analysis immediately improves signal quality. The New York open session (13:00-17:00 UTC) produces the highest-reliability intraday reversal patterns due to volume concentration and reduced participation from Asian algorithmic accounts.
Explore Forex Trading for Beginners to understand how session times impact candlestick reliability. Study Triple Candlestick Pattern to recognize multi-candle reversal structures that carry higher statistical weight than single-candle formations. Three-candle reversals inherently filter out false signals better than single patterns due to their requirement for sustained momentum confirmation.
Key Takeaways
- Reversal candlestick patterns are technical formations that signal a potential change in market direction after a sustained trend.
- The Hammer pattern identifies bullish reversals at support with success rates of 60-70% when confirmed by a follow-up bullish candle.
- The Shooting Star pattern signals bearish reversals at resistance, achieving 65-70% success rates on Daily timeframes with proper confirmation.
- Confirmation candles are mandatory for institutional-grade trading, as standalone patterns suffer from 44-50% failure rates due to algorithmic stop-hunting.
- Volume expansion on reversal candles separates genuine institutional reversals from retail ‘stop runs’ designed to trigger liquidations.
- Higher timeframes deliver superior reversal reliability; Daily charts achieve 70% success rates while 15-minute charts produce only 53% accuracy.
Frequently Asked Questions
This article contains references to reversal candlestick patterns, technical analysis, and Volity, a regulated CFD trading platform. This content is produced for educational purposes only and does not constitute financial advice or a recommendation to buy or sell any financial instrument. Always verify current regulatory status and platform details before using any trading service. Some links in this article may be affiliate links.