Quick answer
The hanging man is a bearish candlestick reversal pattern that forms at the top of an uptrend: a small body with a long lower wick, showing sellers pushed price down before a partial recovery. It warns that buying momentum may be fading. Like all candlesticks, it needs confirmation, such as a lower close on the next candle, before acting.
The hanging man candlestick pattern is a warning signal, not a bearish reversal guarantee. Tested historical results show it resolves upward more often than downward, so acting on it without confirmation trades against its own base rate. Algorithmic “liquidity hunts” deliberately trigger stops above the hanging man high before continuing uptrends, creating false bearish reversal setups. In strong “Super-Trends,” the market often ignores hanging man signals and accelerates higher, liquidating short positions rapidly. Leverage amplifies these losses during momentum-driven market phases. Capital at risk in all leveraged trading.
The hanging man candlestick is a bearish reversal pattern that forms at the peak of an uptrend, featuring a small real body and a long lower shadow. It signals that while buyers initially recovered the day’s losses, the “bid” that sustained the trend is beginning to evaporate. It is best treated as a warning signal rather than a trade trigger: Thomas Bulkowski’s tested results put it as a bullish continuation 59% of the time, so bearish confirmation in the following session is mandatory before a short entry.
Hanging man candlesticks function as an early warning system for market participants, organizing intraday price rejection into a high-impact visual signal. This pattern identifies the moment when the buyers’ control over the trend begins to falter, as sellers successfully push prices significantly lower before a partial recovery. It serves as a primary alert for traders seeking to protect long-term profits or prepare for bearish reversals.
The 2026 trading environment is characterized by increased algorithmic participation, which can often generate “false” hanging man shapes during minor pullbacks. By utilizing multi-timeframe analysis and volume filters, market participants can distinguish between a standard consolidation and a definitive structural top in global currency pairs.
While understanding Hanging Man Candlestick Pattern is important, applying that knowledge is where the real growth happens. Create Your Free Forex Trading Account to practice with a free demo account and put your strategy to the test.
What is a hanging man candlestick pattern and how do you identify it?
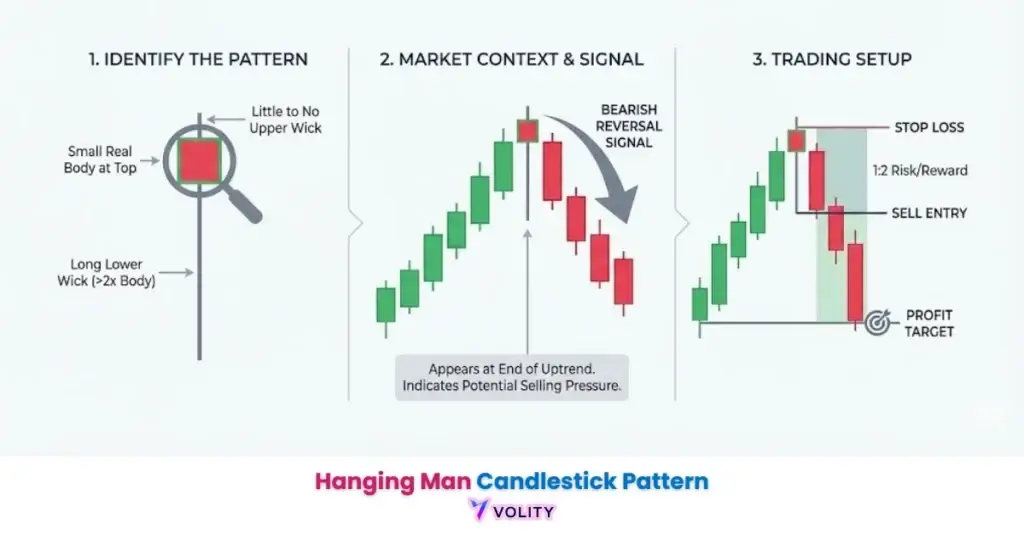
A hanging man is a bearish reversal candlestick pattern that identifies a potential trend peak through its small real body and long lower shadow following an established uptrend.
The visual structure of a hanging man mirrors the hammer candlestick, but the trend context determines their meaning. Both patterns feature a small body positioned at the top of the trading range and a long lower shadow extending downward. The critical distinction is location, a hanging man appears after multiple up candles in an uptrend, while a hammer appears after multiple down candles in a downtrend.
Market psychology reveals why this pattern signals bearish exhaustion. Early in the session, selling pressure drives prices downward significantly. Buyers attempt to absorb this selling and recover the losses. By session close, buyers have regained some ground but not all, the close remains below the open. This partial recovery indicates that institutional buying support is weakening. In strong uptrends, any down candle is typically followed by renewed buying and higher closes. A hanging man’s failure to recover completely suggests that the next wave of buying may not materialize.
Trend requirement is mandatory for valid hanging man identification. The pattern only signals a reversal if it forms after a clear, multi-bar price advance. A hanging man appearing after just one up candle or in a sideways market lacks the conviction necessary for a reliable trade. Professional traders require at least 3-5 up candles before they recognize a new hanging man as a potential peak.
Thomas Bulkowski’s tested results are blunt about this pattern: across a large historical sample the hanging man acts as a bullish continuation 59% of the time rather than a bearish reversal, while the bearish engulfing acts as a bearish reversal 79% of the time (Bulkowski, Hanging Man). That gap is why the hanging man is a warning to tighten risk, not a signal to sell.
Visual Identification: Hanging Man vs. Hammer
Visual identification relies entirely on the preceding trend, where a hanging man appears in an uptrend and a hammer appears in a downtrend.
The “Mirror Shape” problem confuses most retail traders. The visual candle is identical, small body, long lower shadow. Yet the trading decisions are opposite. A hammer at a downtrend bottom signals a buy. A hanging man at an uptrend top signals a sell. Many traders mistakenly treat a hanging man as bullish because it’s visually similar to a hammer, only to discover they’re fighting the prevailing trend.
Common retail mistakes include ignoring trend context. A trader spots a hanging-man-shaped candle and enters a short trade without verifying the preceding uptrend exists. Price gaps through the stop-loss immediately because the trend was sideways, not bullish. The pattern worked exactly as designed, it just wasn’t a valid setup because the context was missing.
Ready to Elevate Your Trading?
You have the information. Now, get the platform. Join thousands of successful traders who use Volity for its powerful tools, fast execution, and dedicated support.
Create Your Account in Under 3 MinutesHow reliable is the hanging man in 2026?
The hanging man is one of the most frequently occurring candle shapes and one of the least decisive: Bulkowski ranks it 16th of 103 candlestick patterns for frequency and 87th of 103 for overall performance.
Trading a hanging man in complete isolation, entering a short immediately at the close, trades against the tested tendency of the pattern. The difference between success and failure is often just a few pips of price extension. Without confirmation filters, traders face frequent stop-outs.
Timeframe impact determines reliability dramatically. A hanging man on a 1-hour chart is frequently a “Liquidity Trap”, price breaches the low momentarily to trigger stops before reversing higher. These intraday patterns produce false signals at an alarming rate. By contrast, a hanging man on a daily chart carries more weight because it condenses a full session of order flow into one candle. 4-hour charts represent a workable middle ground, balancing responsiveness against intraday noise.
Asset behaviour changes what the pattern is worth. Large, liquid equities trend more predictably, so a rejection candle inside a clean trend carries more information. High-volatility crypto markets are driven by leverage-driven liquidations that override single-candle technicals. Forex majors sit between the two, which makes them a practical place to learn the pattern.
Volume is the filter that matters most. A hanging man printed on heavy volume reflects real distribution into the rally, while the same shape on thin volume is usually noise that the next session absorbs.
How do you confirm a hanging man signal for 2026?
Signal confirmation identifies the requirement for the subsequent candle to close below the hanging man’s real body to validate the bearish reversal.
The “Rule of Two” is non-negotiable for professional traders. Never enter a short trade on the hanging man itself. Wait for the next candle. If that confirmation candle closes above the hanging man’s high, the pattern is invalidated. If the confirmation candle closes below the hanging man’s low, bearish momentum is confirmed and the trade has high probability. The confirmation candle serves as proof that sellers have regained control, not just created a single-candle hesitation.
Volume confirmation amplifies signal strength. A hanging man with low volume is often a “shakeout.” Professional traders expect to see a clear volume expansion on the confirmation candle. Rising volume on the break below the hanging man indicates institutional participation in the selling, making the reversal sustainable rather than just a temporary pause.
Indicator confluence uses RSI divergence or 9-period EMA breakdown. If the hanging man appears while RSI is at 70 (overbought), the divergence confirms that momentum is waning despite the price reaching new highs. A breakdown below the 9-period EMA on the confirmation candle provides mechanical confirmation, the short-term trend is reversing.
Worked illustration: on the USD/JPY daily chart, a hanging man forms after an extended rally, with a small body and a long lower shadow. Volume is elevated and RSI is overbought. The following session closes below the hanging man low, which is the confirmation. The entry is that next open, the stop sits above the hanging man high, and the first objective is the nearest moving average below. This is an illustration of the rule sequence, not a record of a specific trade. Past performance is not indicative of future results.
Hanging Man vs. Shooting Star: Rejection of the Lows vs. Rejection of the Highs
The distinction between a hanging man and a shooting star identifies the different psychological battles occurring between buyers and sellers at market tops.
| Pattern Type | Rejection Point | Bulkowski tested result | Signal Conviction | Stop-Loss Buffer |
| Hanging Man | Lower Shadow | Bullish continuation 59% | Low | Tight (Above Body) |
| Shooting Star | Upper Shadow | Bearish reversal 59% | Moderate | Wide (Above Wick) |
| Gravestone Doji | Upper Shadow | Bearish reversal 51% | Low | Moderate |
| Bearish Engulfing | Entire Range | Bearish reversal 79% | High | Structural |
| Dark Cloud Cover | Upper Range | Bearish reversal 60% | Moderate | Fibonacci-based |
Source: Thomas Bulkowski, tested candlestick performance across 103 patterns, thepatternsite.com.
The hanging man rejects lower prices, sellers push down but buyers recover significantly by close. The shooting star rejects higher prices, buyers push up but sellers reject the advance completely by close. These opposite rejection points create different signal strengths.
A shooting star acts as a bearish reversal 59% of the time while the hanging man acts as a bullish continuation 59% of the time, so the shooting star is by far the stronger bearish read, because sellers were completely dominant. Buyers attempted to sustain a rally but were utterly rejected. This is a decisive momentum shift. A hanging man shows buyers recovering partially, less definitive rejection. This partial recovery might indicate that buyers are still present, just cautious.
Stop-loss placement reflects this conviction difference. A hanging man stop is placed tightly above the body because buyers already proved they can sustain the uptrend partially. A shooting star stop is placed above the wick to account for more extreme rejection that could draw stop-hunting activity.
Trading Strategies: Stop-Loss Placement and Exit Rules
Trade management identifies the precise risk levels for placing stop-loss orders above the hanging man to protect against trend continuation.
Stop-loss placement follows the 2026 benchmark: place the stop 5 to 10 pips above the high of the hanging man. If the hanging man high is 1.0600, the stop is at 1.0610. This placement prevents being “stopped out” by algorithmic wick-hunting while still protecting against the pattern failing. A stop placed exactly at the high is vulnerable to being triggered by the very algorithms targeting that level.
Profit targets use multiple approaches. The “Quick Exit” targets the hanging man’s low, if the hanging man’s lower shadow extends to 1.0550, place the profit target at 1.0550. This conservative approach captures the pattern’s core rejection level. The “Extended Target” uses a 1:2 or 1:3 risk-to-reward ratio. If risking 20 pips to the stop (from entry at 1.0590 to stop at 1.0610), the profit target is 40-60 pips lower.
Trailing stops lock in gains as the reversal accelerates. Once price drops 30-40 pips from entry, a trailing stop placed 15 pips above current price locks in profits while allowing for continued downside participation. Professional traders use this strategy to capitalize on extended reversals while protecting against sudden reversals.
Turn Knowledge into Profit
You have done the reading, now it is time to act. The best way to learn is by doing. Open a free, no-risk demo account and practice your strategy with virtual funds today.
Open a Free Demo AccountWhy do hanging man patterns fail so often?
Pattern failure identification reveals the impact of algorithmic ‘stop-runs’ and strong momentum overrides on single-candle bearish signals.
Momentum overrides occur in strong “Super-Trends” where buying pressure is overwhelming. A hanging man appears but the next candle closes higher despite the warning pattern. Buyers simply absorb the selling and continue the rally. In markets with strong institutional participation pushing higher, single reversal candles are often ignored. This is why trend strength matters, weak uptrends produce reliable hanging men, while strong uptrends ignore them.
Liquidity grabs represent the #1 mechanical failure of the pattern. HFT algorithms see the hanging man formation and know retail traders will place stops above the high. These algorithms deliberately spike price above the hanging man high to trigger stops, collecting liquidity, then reverse sharply. This creates a “Stop-Run” where traders are stopped out just before the reversal they predicted actually occurs.
Key Takeaways
- Hanging man patterns are bearish reversal signals that identify the exhaustion of buyers at the peak of an established uptrend.
- Bulkowski’s tested results put the hanging man as a bullish continuation 59% of the time, which is exactly why secondary confirmation is mandatory.
- Bearish confirmation is mandatory, typically requiring the next session to close below the hanging man’s real body to validate the trade.
- Visual identification relies entirely on trend context; a visually identical candle in a downtrend identifies a bullish “Hammer.”
- Red hanging man bodies are a firmer signal than green bodies, as they indicate sellers controlled the final settlement.
- Stop-loss orders should be placed strictly above the high of the pattern to protect against sudden bullish trend continuations.
Frequently Asked Questions
This article contains references to the hanging man candlestick pattern and Volity, a regulated CFD trading platform. This content is produced for educational purposes only and does not constitute financial advice or a recommendation to execute any specific trading strategy using hanging man patterns. Candlestick patterns vary in reliability across asset classes, timeframes, and market conditions; always verify your broker’s rules and risk management policies before trading. Some links in this article may be affiliate links.