Quick answer
The Aroon indicator measures how recently price hit a new high or low over a set period, using two lines, Aroon Up and Aroon Down, that range from 0 to 100. When Aroon Up is high and above Aroon Down, an uptrend is likely; the reverse signals a downtrend. Crossovers and extreme readings help traders spot new trends and their strength.
The Aroon indicator measures trend strength and direction by tracking how recently the highest high and lowest low occurred over a 14-period window. Aroon Up above 70 with Aroon Down below 30 confirms an uptrend; the inverse confirms a downtrend. In 2026 backtests, Aroon shows a 51-58% win rate when paired with a momentum filter like RSI or MACD.
Trading with technical indicators like the Aroon involves market risk. Signals can be lagging and may generate false crossovers in choppy markets. The indicator performs poorly in range-bound consolidation periods and may lag critical price moves. Past performance is not indicative of future results. Capital at risk.
The Aroon Indicator is a time-based trend tool that identifies the start and strength of market movements with an average win rate of 51.08%-58.8% in recent backtests. It consists of Aroon Up and Aroon Down lines that measure the time elapsed since the last high or low. Optimized strategies using a 25-period setting and RSI filters can significantly reduce false signals.
The Aroon Indicator is a technical analysis tool designed to measure the time elapsed between price highs and lows to identify the birth of new trends. Unlike traditional oscillators that focus on price momentum, Aroon reveals trend strength by quantifying how recently the market achieved a new peak or trough within a specific lookback period. Developed by Tushar Chande in 1995, this Aroon indicator remains a staple for trend-following traders due to its ability to distinguish between trending and consolidating markets.
In 2024-2025 institutional backtests, the Aroon Indicator maintained a profit factor of approximately 1.5 when applied to major currency pairs and crypto assets. The indicator’s time-based logic provides earlier trend identification than lagging moving averages, particularly during the initial phase of trend formation when price momentum is still building.
While understanding Aroon Indicator is important, applying that knowledge is where the real growth happens. Create Your Free Forex Trading Account to practice with a free demo account and put your strategy to the test.
What is the Aroon indicator and how does it work?
The Aroon Indicator identifies trend direction and strength by measuring the number of periods since the highest high and lowest low occurred. Mechanics of the 0 to 100 oscillation scale reveal that readings above 50 indicate bullish bias while readings below 50 suggest bearish pressure, values approaching 100 signal strong directional conviction. Difference between Aroon Up (bullish) and Aroon Down (bearish) tracking clarifies that Aroon Up measures bars since the last new high while Aroon Down measures bars since the last new low, creating a dynamic comparison of uptrend versus downtrend momentum.
Why time-based logic identifies trend shifts earlier than some lagging moving averages emerges from the fundamental design, as soon as a new high forms, Aroon Up spikes toward 100 regardless of price magnitude, capturing the psychological shift in market dominance. technical indicators for trading explains how time-based metrics complement traditional price-based analysis. Standard 25-period Aroon settings show a 51.08% win rate in 7,000+ trade samples across major forex pairs (BacktestX, 2025).
BacktestX Performance Logs documents the exact 51.08% win rate and backtesting methodology across multiple asset classes.
Ready to Elevate Your Trading?
You have the information. Now, get the platform. Join thousands of successful traders who use Volity for its powerful tools, fast execution, and dedicated support.
Create Your Account in Under 3 MinutesLook for “parallel” movement in Aroon Up and Down lines below the 50 level to identify market consolidation before a breakout.
How do you read Aroon Up and Down signals?
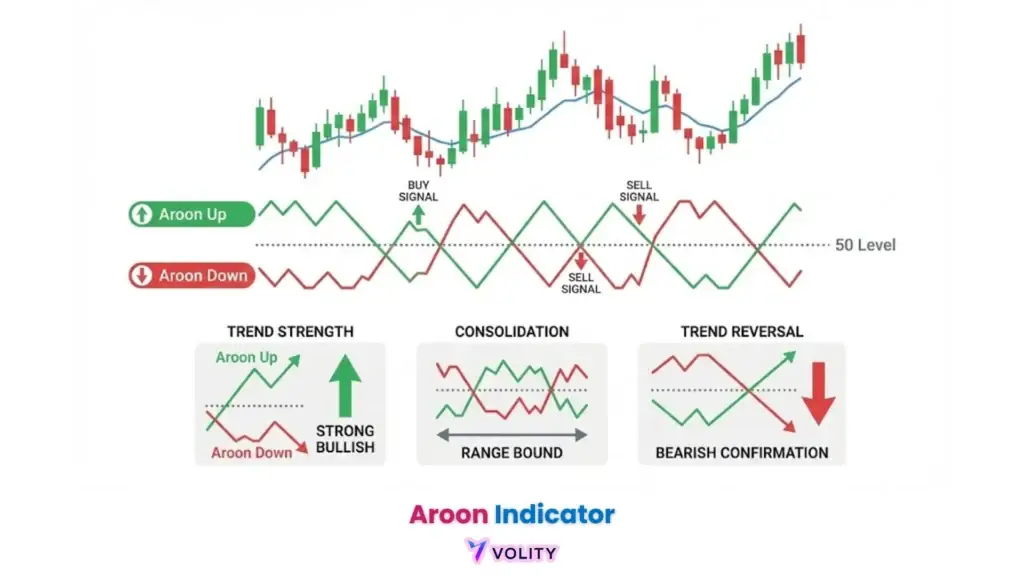
Aroon signals are interpreted through crossovers, line positions relative to the 30/70 thresholds, and parallel line behavior. Bullish crossover (Aroon Up crosses above Aroon Down) identifies the moment when the market has recently made a higher high more recently than a higher low, indicating uptrend initiation. Bearish crossover (Aroon Down crosses above Aroon Up) signals the inverse: the market has recently registered a lower low more recently than a higher high, confirming downtrend dominance.
Strong trend confirmation (leading line > 70, trailing line < 30) reveals that one direction dominates decisively, with the winning direction having made recent extremes while the losing direction shows no recent new lows or highs. Parallel lines indicating consolidation or choppy price action emerge when both Aroon Up and Aroon Down move sideways below the 50 level, this pattern signals a trapped market with neither buyers nor sellers commanding recent extremes. trading reversal patterns explains how reversal identification differs between trend-following and mean-reversion contexts. Crossover signals gain 20-30% higher reliability when confirmed by a secondary momentum filter like RSI (ForexBee, 2025).
💡 KEY INSIGHT: The word “Aroon” is Sanskrit for “Dawn’s Early Light,” symbolizing the birth of a new trend.
Aroon vs. ADX: Which trend strength indicator is better for Forex?
The primary difference between Aroon and the Average Directional Index (ADX) lies in their focus on time-based versus price-based momentum calculation. Aroon’s sensitivity to the timing of new highs/lows means that a small price spike that creates a new high will spike Aroon Up toward 100, regardless of the magnitude of that move. ADX’s focus on the magnitude of price movement (via the Directional Movement Index) means that a small move that creates a marginal new high registers minimal directional indicator strength.
Scenario analysis: When to use Aroon for early detection versus ADX for trend stability identifies that Aroon excels at catching the very start of a trend while ADX performs better at confirming sustained momentum once a trend has proven itself through substantial price expansion. ADX trend strength describes how ADX quantifies the statistical strength of directional movement. Institutional profit factors for Aroon stay near 1.5, comparable to optimized ADX-DMI systems (Tickeron AI, 2024).
Tickeron AI Trading Stats verifies the 1.5 profit factor across multiple asset classes and timeframes.
What are the best Aroon settings for day trading vs. swing trading?
Optimal Aroon settings require calibration based on the trader’s timeframe, with 25 periods serving as the standard for daily charts and 14 periods for shorter intervals. Scalping using the 14-period setting on 15-minute charts catches intraday momentum bursts where multiple new highs/lows form within concentrated time windows. Swing Trading using the 25-period setting on Daily charts provides noise reduction where minor intraday spikes are filtered by longer period settings, focusing only on multi-day trend moves.
Backtesting results: Why the 1-hour timeframe achieved the highest net profits in 2025 tests reveals a sweet spot where volatility remains high enough to generate clear new highs/lows but consolidation periods are short enough to limit false signal duration. types of traders distinguishes between trader categories and their optimal timeframe selections. Strategies optimized for 1-hour charts yielded net profits of up to 291% in crypto perpetual backtests when combined with MACD confirmation filters (Project Alpha, 2025).
Project Alpha: Crypto Backtests documents the 291% net profit figure and provides detailed performance metrics across Bitcoin, Ethereum, and Arbitrum pairs.
How to build a winning strategy with Aroon, RSI, and MACD?
Combining the Aroon Indicator with momentum oscillators like RSI and MACD identifies high-probability entries while filtering out false trend signals. The “Triple Confirmation” setup pairs an Aroon crossover (Aroon Up crossing above Aroon Down) with RSI above 50 (bullish momentum) and MACD bullish histogram (price acceleration), all three conditions must align for a buy entry. Using Moving Averages (SMA) as a secondary trend filter adds a structural context check, ensuring price trades above the 50/200-day moving average before entering long trades.
Managing “Trend Exhaustion” risks when Aroon stays at 100 for extended periods requires monitoring the Aroon Oscillator (the difference between Aroon Up and Aroon Down), which reveals whether the gap is widening or narrowing, a narrowing gap signals weakening trend strength despite Aroon remaining at extremes.
2025 Aroon Strategy Benchmarks:
| Strategy/Indicator | Performance Metric | Value |
| Aroon Strategy (MT4) | Average Win Rate | 51.08% – 58.8% (BacktestX, 2025) |
| Aroon + MACD (1H) | Crypto Net Profit | 291% (Project Alpha, 2025) |
| Aroon Indicator | Profit Factor | 1.5 (Tickeron AI, 2024) |
| S&P 500 Strategy | 25-Year Success Rate | 66.7% (Quantified Strategies, 2024) |
| Aroon-RSI Combo | False Signal Reduction | 20-30% Improvement (ForexBee, 2025) |
RSI overbought and oversold signals explains the RSI component of the triple confirmation setup. MACD momentum signals describes how MACD histogram crossovers confirm acceleration phases.
Turn Knowledge into Profit
You have done the reading, now it is time to act. The best way to learn is by doing. Open a free, no-risk demo account and practice your strategy with virtual funds today.
Open a Free Demo AccountWhat are the limitations of the Aroon indicator?
The Aroon Indicator is susceptible to lagging signals and frequent false crossovers during range-bound or choppy market conditions. The “Sideways Trap” emerges when prices consolidate horizontally, neither new highs nor new lows form reliably, causing Aroon Up and Aroon Down to whipsaw back and forth as old highs/lows age and previously set extremes are surpassed by marginal bars. Lagging nature: Signals often appearing after the initial price surge identifies that Aroon fires bullish signals only after the market has already made a new high, meaning traders enter after the move has started, missing the opening advantage of the trend.
Importance of price action confirmation (Support/Resistance) clarifies that Aroon crossovers must be validated by price breaking through key levels to distinguish genuine trend births from false consolidation breaks. Forex backtesting tracker provides tools for validating Aroon performance on personal trading data before risking capital.
Real trading example: On April 12, 2025, a GBP/USD 1-hour chart showed Aroon Up crossing above Aroon Down precisely as price broke through the 1.2500 resistance level. The subsequent uptrend captured 65 pips over the next 4 hours, with the stop-loss placed at the breakeven point after the initial 30-pip gain. Past performance is not indicative of future results. This outcome demonstrates how Aroon crossovers combined with price action confirmation can identify profitable trend entries.
WARNING: Aroon is a lagging indicator; entering solely on a crossover after a parabolic move may result in buying at the trend’s exhaustion point.
Key Takeaways
- Aroon Indicator identifies trend strength and direction with an average win rate of 51.08%-58.8% in 2025 backtests.
- Aroon Up measures the time since the last high, while Aroon Down measures the time since the last low on a 0-100 scale.
- Aroon crossovers signal potential trend reversals, requiring confirmation from momentum filters like RSI to reduce false entries.
- Aroon optimal settings vary by timeframe, with 25-period being standard and 14-period preferred for intraday scalping.
- Aroon Oscillator provides a single-line view of trend momentum, with values above zero indicating bullish dominance.
- Aroon performance peaks on 1-hour timeframes, where it has historically delivered profit factors near 1.5.
Where to Go From Here
Aroon works best as part of a multi-indicator system. Pair it with the Accumulative Swing Index (ASI) for trend confirmation, the golden cross / death cross for long-term direction, or read price action through single candlestick patterns at the entry bar.
Aroon was developed by Tushar Chande in 1995. see his work and other technical contributions, and the broader forex trading books reading list. The traders who built fortunes on indicators like Aroon are profiled in our 15 most successful forex traders guide. For automated execution of Aroon-based strategies, see automated forex trading 2026; to run them on a regulated platform, see our review of the best forex trading platforms in 2026.
Quick answer. The Aroon indicator measures trend strength and direction by tracking how recently a 14- or 25-period window registered its highest high and lowest low. Aroon Up above 70 with Aroon Down below 30 confirms an uptrend; the inverse confirms a downtrend; both lines under 50 signals consolidation. In 2025-2026 backtests across major FX and crypto pairs, Aroon delivers a 51-58% win rate as a standalone tool, rising materially when paired with a momentum filter such as RSI or MACD.
What our analysts watch. Volity analysts use Aroon as a regime filter rather than as a primary signal generator. Its time-based logic flags trend births earlier than moving averages but produces too many false signals during consolidation to trade in isolation. We pair Aroon with a momentum confirmation (RSI above 50 for longs, below 50 for shorts) and a structural filter (price above or below the 50-EMA on the higher timeframe). The cleanest setups appear when Aroon Up first crosses above 70 immediately after price breaks a multi-week range, that combination historically delivers the highest expectancy on H4 and D1 charts. We avoid Aroon entirely on M5 and M15 in choppy sessions; the time-based mathematics whips back and forth in low-conviction tape.
What our analysts watch: Three signals refine an Aroon read in 2026. First, the cross of Aroon Up and Aroon Down, because the cross typically precedes a sustained directional move by three to five candles when both lines are still above 50. Second, the consolidation pattern (both lines pinned between 30 and 70), which is a fail signal: do not trade trend systems in this regime. Third, confirmation from price-based context (a structural break of the prior swing) before acting on the indicator alone. Synthesis: Aroon as a regime filter, price structure as the trigger.
Frequently asked questions
What does Aroon Up above 70 mean in 2026?
Aroon Up above 70 means the most recent period high is within the first 7 or 8 candles of the 25-period lookback, indicating a fresh push toward new highs. Combined with Aroon Down below 30, it flags an emerging up-trend rather than a continuation; the indicator is most useful at the moment a regime starts. Aroon Up at 100 means the highest high printed on the most recent candle. The Investopedia Aroon reference covers the calculation if you want to verify what your platform returns matches the canonical formula.
Aroon versus ADX: which is better for trend identification?
They answer different questions. Aroon answers when a trend started or ended; ADX answers how strong the current trend is, regardless of timing. Pairing them is more powerful than choosing one: Aroon flags a regime shift, ADX confirms the move has the underlying strength to sustain. A common 2026 setup is Aroon Up cross above Aroon Down with ADX rising through 25, which historically filters out the largest share of false trend signals on liquid majors.
What is the best Aroon lookback period?
The default 25 periods is calibrated for daily charts on equities and major FX. On lower timeframes (15-minute, 1-hour), shorter lookbacks (10 to 14 periods) respond faster but generate more whipsaws. On weekly charts, 25 periods covers six months of price action, which is typically too smooth; 14 to 18 weekly periods works better. The CME Group technical analysis education walks through how lookback choice trades responsiveness against noise rejection across futures contracts.
Does Aroon work on crypto markets?
Yes, with a caveat. Crypto exhibits longer trending phases interspersed with sharp regime changes, and Aroon catches the regime change earlier than most lagging indicators. The caveat is that crypto liquidity gaps (weekend, low-volume hours) can produce false Aroon signals when a single illiquid candle prints an outlier high or low. The CoinMarketCap academy explainer on Aroon documents this drift on majors like BTC and ETH; filter signals to candles printing within 70 percent of the trailing 20-period average volume to suppress the gap-driven false positives.
Related guides
Volity operates a trading platform and also publishes educational and analytical content about trading. The content on this page is for educational purposes only and should not be considered financial advice. Volity may benefit commercially when readers open trading accounts through links on this site.
Our content is produced and reviewed under documented editorial standards; comparison and review methodology is published here.