The US500 is a contract for difference that tracks the S&P 500, the index of 500 leading United States companies. Trading the US500 CFD lets you go long or short on the broad United States stock market from a single position on Volity MT, with product-dependent leverage and no share ownership.
What is the US500?
US500 is the CFD ticker most platforms use for the S&P 500, the benchmark index of the United States stock market. It is compiled by S&P Dow Jones Indices, which picks 500 large companies through an index committee that weighs market size, liquidity and profitability. Together those companies cover roughly 80% of the total value of the United States equity market, which is why the US500 index is treated as the headline gauge for United States stocks. If indices are new to you, our explainer on what a stock index is covers the groundwork first.
The index is float-adjusted capitalisation weighted, so each company counts in proportion to the market value of its freely traded shares. That makes the US500 broader and more diversified than a 30-name benchmark, while the largest companies still lead at the top. Trading it is a way to take a single view on the direction of United States equities as a whole.
Which stocks are in the US500?
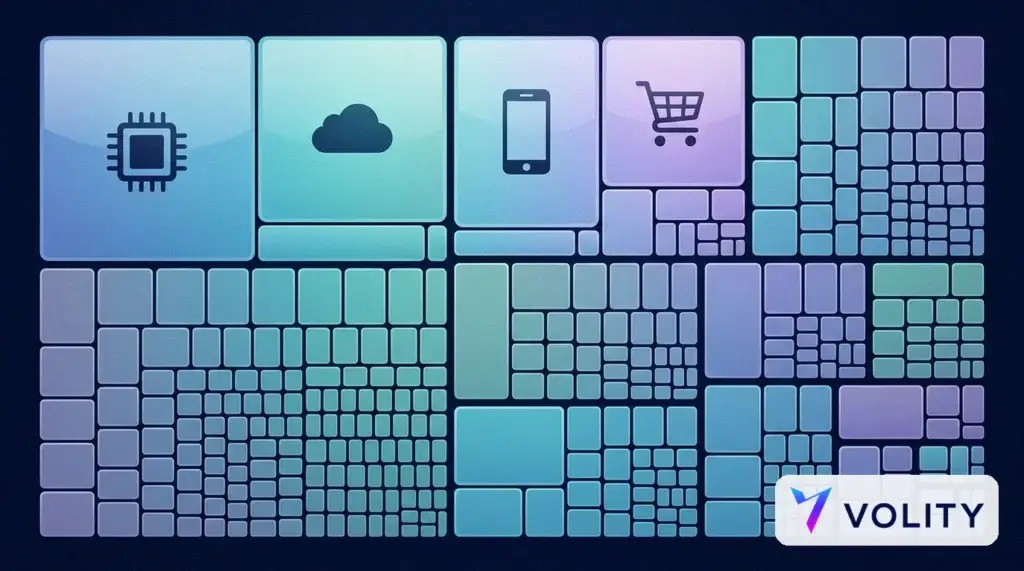
The US500 stocks span every major sector, but the top of the index is concentrated in a handful of very large companies. A representative view of the largest US500 stocks looks like this.
| Company | Sector | Role in the index |
| Apple | Technology | Among the two largest weights |
| Microsoft | Technology | Core large-cap anchor |
| Nvidia | Semiconductors | Swings the index on AI demand |
| Amazon | Consumer and cloud | Consumer and cloud exposure |
| Alphabet | Communication services | Internet and advertising |
| Meta Platforms | Communication services | Advertising exposure |
| Berkshire Hathaway | Financials | Diversified conglomerate weight |
| Broadcom | Semiconductors | Second major chip weight |
Because it is capitalisation weighted, the largest ten US500 stocks can make up around a third of the index. A strong or weak run in the mega-cap technology names can therefore move the whole US500, even though the index holds 500 companies across every sector of the economy.
How does a US500 CFD work, and how is it different from US500 futures?
A US500 CFD is an agreement to exchange the difference in the index price between the moment you open a position and the moment you close it, so you trade the price move directly. Unlike buying the 500 shares, holding an exchange traded fund, or trading US500 futures, which are standardised exchange contracts with fixed sizes and quarterly expiry dates that have to be rolled, the CFD has no expiry and can be sized to your account.
- You can go long if you expect the index to rise or short if you expect it to fall, with no stock borrowing needed to sell short.
- You post margin instead of the full contract value, with leverage up to 1:500 (product-dependent), which magnifies gains and losses alike and makes position sizing essential.
- You hold no shares, and in place of a direct dividend the CFD applies a dividend adjustment when constituents pay out, credited to long positions and debited from short ones.
Trading the US500 this way is about its price swings, not long-term ownership. If your aim is instead to buy and hold the S&P 500 through an index fund, that is a separate route with its own cost and tax profile, and it sits outside what this CFD guide covers.
Because leverage magnifies losses as fast as gains, regulators such as the FCA and ESMA restrict how CFDs are sold to retail clients. Treat that as a cue to size every position deliberately and cap the risk you take on each trade.
Volity offers the US500 as a CFD alongside other global index CFDs, forex, commodities and crypto in one account, with CySEC-regulated execution under UBK Markets (licence 186/12). You can trade index CFDs on Volity across the major United States, European and Asian benchmarks from the same login.
When can you trade the US500, and what does it cost?
The S&P 500 constituents trade during the United States cash session, 09:30 to 16:00 New York time, which is when the US500 is most liquid and its spread tightest. The US500 CFD tracks the index across the trading week and commonly quotes for extended hours around the cash session, so you can trade the reaction to after-hours earnings and overnight news.
Your running costs are the spread quoted in index points, an overnight financing charge on positions held past the daily rollover, and a dividend adjustment when constituents pay dividends, credited to long positions and debited from short ones. Funding in a currency other than the quote currency involves a 1% conversion, and the Markets account carries no separate commission on the US500. Full pricing sits on the charges and fees page.
What moves the US500?
As the broad United States benchmark, the US500 responds to the health of the whole economy rather than any single company. A familiar set of drivers is worth keeping in view.
- Interest rate policy sets the backdrop, so Federal Reserve decisions and the outlook for rates are the single biggest macro force on the index.
- Inflation and employment releases, such as the monthly consumer price data, reset expectations for growth and rates.
- Earnings from the mega-cap members carry heavy weight, so a single set of results can move the whole index.
- Rising bond yields pressure valuations, and they bite hardest on the growth companies at the top of the index.
- Broad risk-on and risk-off swings pull the US500 along, and it often sets the tone the rest of world markets follow.
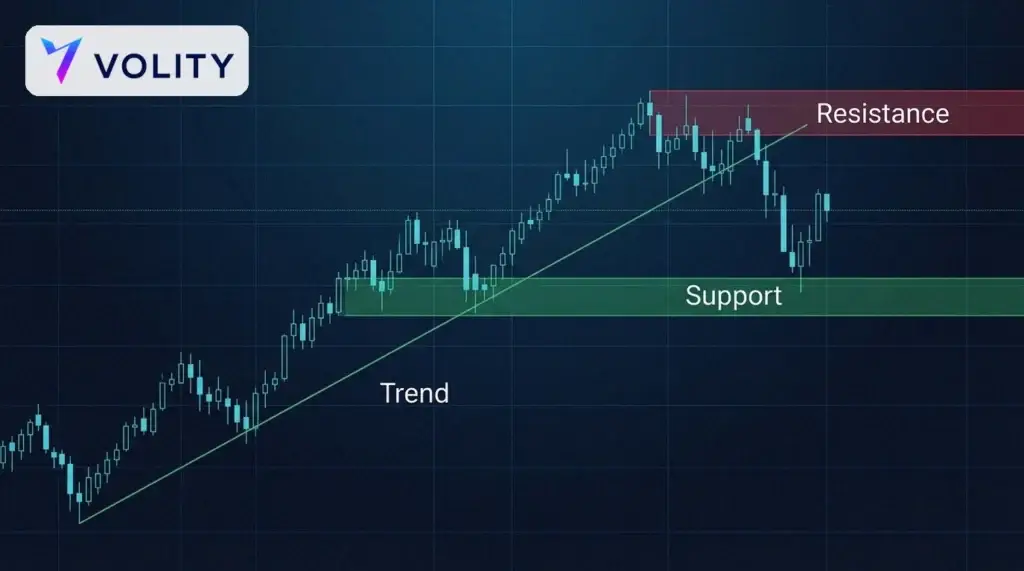
The point of a chart like this is to identify levels, not to predict a price. Marking the current trend and the zones where the US500 has reacted before frames your entries, stops and targets, and it lets you judge a move against a plan rather than a guess.
How to trade the US500 on Volity
- Open a Volity account and complete the quick KYC checks, or start on a free demo.
- Fund your wallet by card, SEPA or crypto. Opening the account is free, and you can start trading from $1.
- Open the US500 instrument in Volity MT and study the live chart, using the built-in TradingView charting to read the current price and mark your levels.
- Choose your direction from your own analysis, set your size from the margin shown on the order ticket, and attach a stop-loss and take-profit.
- Place the order and manage the position, trailing your stop as it moves in your favour and reviewing the result afterwards.
For the same discipline applied across the major benchmarks, our guide on how to trade indices walks through it step by step.
What sectors make up the US500?
Unlike a 30-name index, the US500 spreads across every sector of the United States economy, which is what makes it the standard measure of the market as a whole. The weightings shift over time, but the broad shape stays consistent.
- Information technology is the largest sector, home to the biggest hardware, software and semiconductor names.
- Communication services adds the large internet and media companies.
- Financials cover the banks, insurers and payment networks.
- Healthcare spans pharmaceuticals, insurers and device makers.
- Consumer discretionary and staples track spending across both cyclical and defensive goods.
- Industrials, energy, materials, utilities and real estate round out the balance between the cyclical and defensive parts of the economy.
Because technology and communication services now carry the heaviest weights, the US500 has grown more sensitive to a handful of very large growth companies than it was a decade ago. A broad index, in other words, can still be driven by a narrow group at the top.
Why do traders watch the US500 so closely?
The US500 is treated as the pulse of global risk appetite. When it rises, capital tends to flow toward riskier assets worldwide; when it falls, the effect ripples through other equity indices, currencies and commodities. A few things give it that outsized role.
- It is broad, holding 500 companies across every sector, so it reflects the real economy better than a narrow index does.
- It is deep, among the most liquid instruments in the world, which makes its price hard to distort and quick to absorb news.
- It is a reference point, with countless funds and products benchmarked to it, so its level shapes decisions well beyond the traders watching the chart.
For a trader, that means the US500 is rarely just one market among many. It often sets the tone the others follow, which is why many traders keep it on screen even when trading something else. A strong or weak US500 open often signals how forex, commodities and other equity indices will behave through the session, so plenty of desks read it first thing as a barometer of global risk before placing any order. Watching how the index reacts to a scheduled event, rather than trying to guess the outcome in advance, is usually the steadier way to trade it.
Related guides
Frequently asked questions
What is the US500 in trading?
The US500 is a CFD that tracks the S&P 500, the index of 500 leading United States companies covering about 80% of the country’s equity market value. Trading the US500 gives you exposure to the broad United States stock market in a single instrument, so you can go long or short with leverage rather than buying the 500 shares one by one.
Is the US500 the same as the S&P 500?
Yes. US500 is the name most platforms give to a CFD that tracks the S&P 500. The price follows the index closely, but as a CFD it lets you go long or short with leverage and carries financing and dividend adjustments rather than paying dividends directly.
Is the US500 the same as US500 futures?
They track the same index but differ as products. US500 futures are standardised exchange contracts with fixed sizes and quarterly expiry that must be rolled. A US500 CFD tracks the index price, has no expiry, can be sized flexibly, and is traded on Volity as a contract for difference.
Where can I see the live US500 price and chart?
The live US500 price and chart sit inside Volity MT, which includes TradingView charting. You can read the current price, draw support and resistance, and add indicators. The chart is a tool for building your own view rather than a source of a ready-made buy or sell call.