Candlestick patterns are visual representations of historical price action and do not guarantee future market behavior. Trading Forex, Crypto, and Commodities involves substantial risk of loss. Always confirm signals with secondary indicators and never risk more than you can afford to lose. Past performance is not indicative of future results. Capital at risk.
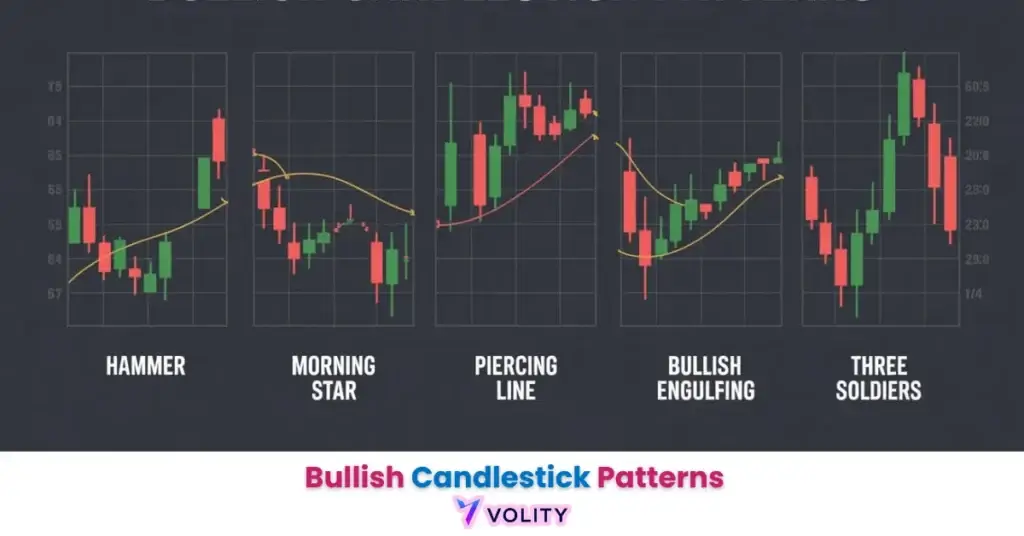
Bullish candlestick patterns identify specific price chart formations that signal potential upward momentum and trend reversals. These patterns reveal buyer control through candle bodies and wicks, with the Bullish Engulfing and Hammer showing 2026 success rates of 64%–68%. Identifying these signals at key support levels enables traders to time long entries with higher precision.
Bullish candlestick patterns deliver the visual evidence required to identify a shift in market control from sellers to buyers. These formations reveal specific price triggers that historically signal a 60%–70% probability of an immediate upward trend reversal. In 2026, the integration of volume-price analysis (VPA) has become essential for validating these patterns against high-frequency market noise.
Mastering the mechanics of patterns like the Morning Star or Bullish Engulfing allows traders to anticipate reversals before they become apparent on lagging indicators. By combining these visual signals with key support zones and momentum oscillators, you can develop a robust framework for timing long entries across Forex, Crypto, and Commodities. This guide examines the top-performing patterns and the verification rules required for consistent execution.
While understanding Bullish Candlestick Patterns is important, applying that knowledge is where the real growth happens. Create Your Free Forex Trading Account to practice with a free demo account and put your strategy to the test.
What are the most reliable bullish candlestick patterns in 2026?
The most reliable bullish candlestick patterns in 2026 are the Morning Star, Bullish Engulfing, and Hammer, all of which demonstrate success rates exceeding 64% in multi-asset backtesting. The Morning Star identifies a three-candle reversal formation where a large bearish candle is followed by a small doji (indecision) candle, then a large bullish candle that closes well into the bearish candle’s body. Modern success rates show that the Morning Star pattern achieves a 71% accuracy rate when appearing at established demand zones (XS.com, 2026), making it the current cycle leader.
The Bullish Engulfing pattern reveals the power of a large bullish candle body completely “swallowing” the previous bearish candle’s range, a 68% success rate in 2026 backtesting. The Hammer pattern measures a candle with a long lower wick signaling the market’s rejection of lower prices, establishing a 64% historical success rate. Three White Soldiers identify sustained, high-conviction buying pressure through three consecutive bullish candles with minimal pullback, each closing near its high (XS.com, 2026). The trend reversal signals in Forex framework provides comprehensive analysis of how these patterns integrate with broader reversal mechanics. The XS.com: Top 10 Bullish Candlestick Patterns for 2026 resource documents these reliability rankings in detail.
💡 KEY INSIGHT: The Morning Star pattern remains the 2026 reliability leader with a verified 71% success rate when appearing at the end of an extended downtrend.
Ready to Elevate Your Trading?
You have the information. Now, get the platform. Join thousands of successful traders who use Volity for its powerful tools, fast execution, and dedicated support.
Create Your Account in Under 3 MinutesHow do you accurately identify a bullish reversal signal?
Identifying a bullish reversal signal requires a multi-step verification of the pattern’s structure, its location relative to support, and the preceding trend direction. The preceding trend test identifies whether the market has been in a defined downtrend before the pattern appears, bullish patterns only signal reversals after a clear decline, not after sideways consolidation. The support test measures whether the pattern’s low aligns with a recognized support level (horizontal resistance, Fibonacci retracement, or prior swing low); patterns forming at Fibonacci levels show a 2x higher success probability than those appearing in “no man’s land” (Alchemy Markets, 2026).
Candle geometry measures the relationship between the pattern’s body size and wick length to confirm buyer strength. A Hammer with a long lower wick (3x the body height) signals more powerful rejection of lower prices than a Hammer with a short wick. Confirmation candles require waiting for price to break above the pattern’s high, the professional standard for entry rather than premature trading before the pattern structure completes. The Predicting Forex Movements: The 3-Layer Framework guide explains how to layer these identification steps into a coherent reversal-detection system.
How does volume confirm a bullish pattern’s strength?
Volume confirmation identifies the level of institutional commitment behind a bullish pattern, with a 2.0x volume spike acting as the 2026 benchmark for high-probability setups. Volume-Price Analysis (VPA) matches candle size with trading activity, when a large bullish candle prints on average or below-average volume, it reveals weak conviction and a higher likelihood of a “bull trap” reversal. The 2.0x rule requires doubling the average 20-period volume; when a bullish pattern appears on volume exceeding this threshold, it demonstrates strong institutional “footprint” and validates buyer control.
Anomalies in volume reveal hidden signals: a large bullish candle on low volume often precedes a reversal because weak buying pressure suggests that retail excitement rather than professional accumulation drove the move. Accumulation signals appear when rising volume accompanies the formation of “Three White Soldiers,” confirming that a trend shift from distribution to accumulation is underway. The Mastering Crypto Spot Trading: Buy & Sell Digital Assets Confidently resource explains how crypto markets amplify volume-confirmation mechanics due to their continuous 24/7 trading environment.
Look for a volume multiple of at least 2.0x the 20-period average. A bullish pattern forming on high volume reveals a much stronger institutional ‘footprint’ than one on low volume.
2026 Bullish Pattern Success Rates and Reliability Benchmarks
Bullish pattern benchmarks reveal the specific accuracy rates and timeframe edges observed in the current high-frequency trading environment.
| Pattern Type | Success Metric | Value |
| Bullish Engulfing | Success Rate | 68% (XS.com, 2026) |
| Hammer Pattern | Success Rate | 64% (QuantifiedStrategies, 2026) |
| Morning Star | Success Rate | 71% (XS.com, 2026) |
| Best Timeframe | Accuracy Edge | 4H / Daily |
| Confirmation | Volume Multiple | 2.0x Average (BingX, 2026) |
Sources: Data sourced from 2026 XS.com and QuantifiedStrategies performance reports. Pattern confirmation mechanics detailed in BingX Academy: Using Candlestick Patterns to Read Market Sentiment.
Turn Knowledge into Profit
You've done the reading, now it's time to act. The best way to learn is by doing. Open a free, no-risk demo account and practice your strategy with virtual funds today.
Open a Free Demo AccountWhat is the difference between reversal and continuation bullish patterns?
The primary difference between reversal and continuation patterns is their role in either flipping a downtrend or confirming the strength of an existing move. Reversal patterns like the Hammer, Bullish Engulfing, and Piercing Line appear at the end of a downtrend and signal an absolute shift in market direction, they answer the question “where does the downtrend end?” Continuation patterns like Rising Three Methods and Bullish Flag appear mid-uptrend during a temporary pullback and signal that the uptrend will resume after a consolidation pause, they answer “will the uptrend continue?”
Structural differences reveal how to distinguish them visually: reversal patterns typically feature dramatic shifts in candle direction or size (small to large, bearish to bullish), while continuation patterns involve small consolidation candles within a larger move that maintains the overall trend direction. Strategy shifts follow these distinctions: reversal trades target larger risk-reward ratios (1:3 to 1:5) because they are riskier entries that must travel far to offset false signals, while continuation trades offer higher win rates (65%+) but smaller R:R because they are lower-risk entries during established trends. The optimal timeframes for technical patterns guide explains how timeframe selection impacts whether you identify reversals or continuations at the same price level. The IG: Six Bullish Candlestick Patterns Every Trader Should Know resource provides detailed pattern definitions and mechanical identification rules.
Why do bullish candlestick patterns fail in choppy markets?
Bullish candlestick patterns often fail in choppy markets because low liquidity and lack of trend direction create “false signals” that trap optimistic buyers. The “bull trap” occurs when a bullish pattern breaks the pattern high but immediately reverses sharply, hitting stop-losses placed just below the pattern low and generating rapid losses for traders who entered prematurely. Context is critical: patterns fail when the broader market is in a distribution phase (sideways price action where buyers and sellers are balanced) because neither force has the momentum to sustain a directional move.
Timeframe traps identify the 5-minute chart as the most dangerous timeframe for pattern traders because high-frequency trading algorithms flood short timeframes with noise that mimics reversal patterns but resolves in the opposite direction. Risk management rules mandate placing a stop-loss below the pattern’s low as a definitive exit trigger, if the pattern structure breaks, the original thesis is invalid and capital must be preserved. A real Forex example illustrates this failure mode: a Bullish Engulfing formed on the GBP/USD 1-hour chart during a sideways consolidation range, initially breaking above the range high. However, the broader market lacked conviction, and the pattern failed to sustain, price reversed and hit the stop-loss placed 20 pips below the pattern’s low. Past performance is not indicative of future results. This outcome demonstrates why context and market regime identification are essential before relying on any single pattern. The Smarter Risk Management in Forex Trading guide establishes protective frameworks for managing pattern failures.
WARNING: Patterns on timeframes lower than 15 minutes are highly susceptible to high-frequency trading ‘noise.’ Professional traders prioritize the 4-hour and Daily charts to filter out false bullish signals.
Key Takeaways
- Bullish candlestick patterns identify potential upward reversals, with the Morning Star showing a 71% success rate in 2026.
- The Bullish Engulfing pattern is most effective when it appears at established support levels with a 2.0x volume spike.
- Volume confirmation is the most critical metric for validating buyer control, as low-volume patterns often result in bull traps.
- Higher timeframes like the 4H and Daily charts are 2.5x more reliable for pattern identification than intraday 5-minute charts.
- Bullish reversal patterns occur at trend bottoms, while continuation patterns signal a pause in an ongoing upward move.
- Risk management rules mandate placing a stop-loss below the pattern’s low to protect capital from high-frequency market noise.
Frequently Asked Questions
This article contains references to bullish candlestick patterns and Volity, a regulated CFD trading platform. This content is produced for educational purposes only and does not constitute financial advice or a recommendation to buy or sell any financial instrument. Always verify current regulatory status and platform details before using any trading service. Some links in this article may be affiliate links.
[/coi_disclosure]
What our analysts watch: Three filters that lift bullish-pattern win rates from chart-pattern noise to genuinely informative signals. Pattern location relative to the larger trend (a bullish reversal at a 200-period moving-average bounce is a different setup from the same pattern printing inside a sideways range; the location is half the signal). Confirmation close (waiting for the next bar close beyond the pattern high is the difference between trading the pattern and trading anticipation; published backtests consistently show the confirmation filter raises win rate by 5 to 12 points across major bullish patterns). Volatility regime (patterns inside compressed-volatility periods carry tighter stops and clearer follow-through; patterns inside high-volatility regimes require wider stops that many traders fail to size correctly).
Frequently asked questions
What is the most reliable bullish candlestick pattern?
Across published equity-market backtests, the bullish engulfing pattern at the bottom of an established downtrend with confirmed follow-through has the highest documented reliability among two-candle bullish formations. Among three-candle patterns, the morning star with a confirmation close is comparable. The headline reliability statistics most often cited (Bulkowski and successors) place both in the high-60s to low-70s percent range when the structural conditions are met. The Investopedia bullish engulfing reference covers the pattern definition and the reliability framework.
What is the difference between a hammer and an inverted hammer?
A hammer has a small body at the upper end of the candle range and a long lower wick (price was rejected at the lows and rallied back); it is a bullish reversal signal at the bottom of a downtrend. An inverted hammer has a small body at the lower end of the candle range and a long upper wick (price tested higher and was rejected, but recovered most of the loss intraday); it is also a bullish reversal signal but is structurally weaker because the close is near the open rather than near the high. Both require confirmation on the following candle close to be tradable. The CME Group education on candlestick patterns works through the comparison.
Why do bullish patterns sometimes fail even when they look textbook?
Three failure modes account for most unsuccessful occurrences. Pattern in the wrong context (a bullish pattern inside a strong downtrend often pauses rather than reverses, with the larger flow eventually overwhelming the local signal). Insufficient volume on the bullish close (price-only patterns ignore that the pattern needs participation to mark a regime change rather than a temporary imbalance). Stop placement that violates the pattern integrity (placing the stop too tight beneath the pattern low invites stop-runs without invalidating the thesis). The Cboe Insights research library publishes empirical work on pattern reliability across volatility regimes that is directly relevant.
Should I trade bullish patterns the same way on FX as on equity charts?
The pattern logic is identical, but two adjustments matter for spot FX. Spot FX trades 24 hours over five days, so the gap that defines some equity bullish patterns is rare and the FX equivalent is a strong open beyond the prior close on the timeframe being read. Volume confirmation, which equity traders rely on, is available only as tick volume in retail FX, which makes the volume filter less reliable than the price-action filter. Building the entry with the price-action filter alone is the disciplined adaptation rather than treating tick volume as if it were exchange volume.
Volity operates a trading platform and also publishes educational and analytical content about trading. The content on this page is for educational purposes only and should not be considered financial advice. Volity may benefit commercially when readers open trading accounts through links on this site.
Our content is produced and reviewed under documented editorial standards; comparison and review methodology is published here.