Investing in financial products involves risk. Losses may exceed the value of your original investment.
The Crypto Trading Starter Kit
A plain-English PDF: what to check before you trade, how orders and risk really work, and the mistakes to skip. Get it free.
Quick answer
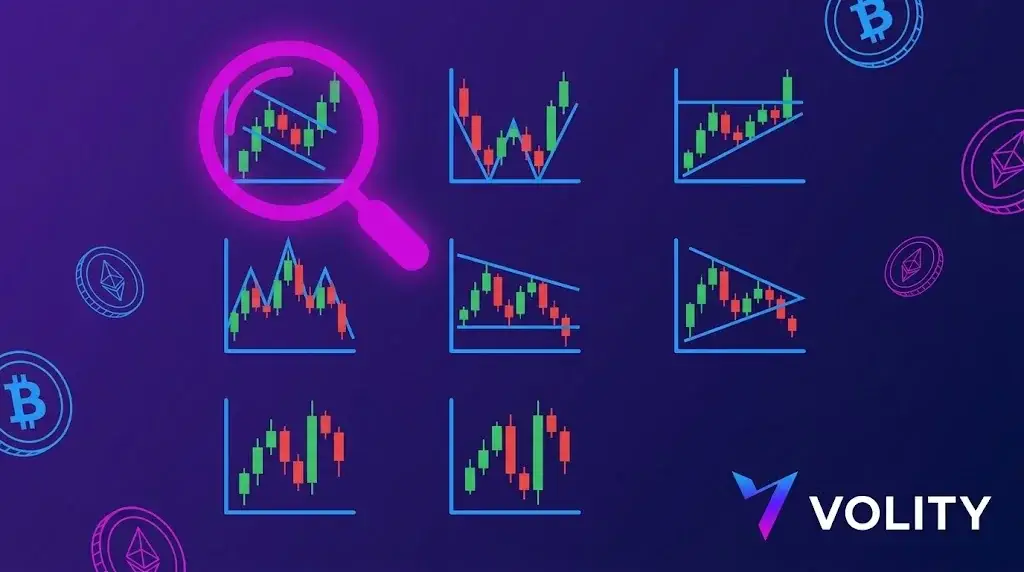
Seven crypto trading patterns that repeat across cycles: bull flag (continuation, ~73% win rate in trend), bear flag (continuation in downtrend), ascending triangle (breakout setup), double top/double bottom (reversal at major levels), head and shoulders (top-pattern reversal), breakout (range-to-trend transition), and mean reversion (range-bound oscillation). Each requires confirmation via volume and trend context.
Crypto trading patterns are repeating price structures that give a trader a defined entry, stop, and target. They are not magic. They are crowd behaviour, encoded in candles. The seven setups below show up week after week on BTC, ETH, and the top-20 alts because the same fear-greed cycle drives them. None of them are 90% win rate. Most cluster around 45-55% with a 1.5-2.5R payoff, which is enough to compound an account if the discipline holds.
Why do patterns repeat at all?
Three structural reasons we keep coming back to:
- Liquidity clusters. Stops sit in the same places: just below recent lows, just above recent highs. Patterns are the price action that runs those stops.
- Reflexive behaviour. Traders see a pattern, traders trade the pattern, the pattern self-fulfils until it stops working.
- News rhythm. Macro and crypto-specific news lands on a roughly weekly cadence (CPI, FOMC, ETF flows, COIN earnings, exchange events). Range-then-break and range-then-fail are the two responses.
1. Bull flag
A sharp upward thrust, then 3-7 candles of orderly pullback inside a tight downward channel, then a break of the upper channel line on rising volume. Entry on the break, stop below the flag low, target equal to the flagpole height projected from the breakout point.
Where it works best: BTC and ETH on the 1-hour and 4-hour, in confirmed uptrends. Where it fails: chop. If the prior thrust is less than 3% the pattern is too small to fund a reasonable stop.
2. Double bottom
Price tests a low, bounces, retests the low (or slightly higher), and reclaims the intervening high. Entry on the reclaim, stop below the second low, target the prior swing high.
The pattern earns its keep at obvious support: round numbers ($60,000 BTC, $3,000 ETH), prior breakout points, and 200-day moving averages. We want to see RSI divergence on the second test.
3. Ascending triangle
Flat resistance, rising support. Price gets compressed into the apex and breaks one direction with conviction. The bias is for an upside break in an uptrend, but the pattern is symmetrical in spirit.
Entry on the close beyond the trigger line, stop on the opposite side of the triangle, target the height of the triangle projected from the breakout.
4. Head and shoulders (and inverse)
Three peaks, the middle one the highest. A break of the neckline confirms the pattern. Inverse is the same logic for a bottom. The pattern is over-cited and not always clean. The version we trade requires volume to climb on the right shoulder retest and a daily close beyond the neckline.
5. Range break
BTC spends 60% of its time in ranges. A range that holds for at least 5 trading days, then breaks on volume at least 1.5x the 20-day average, is one of the highest-quality setups in crypto. Entry on the close beyond the range, stop at the midpoint, target equal to range height projected.
6. Failed breakout (the bull trap and bear trap)
Price breaks a level, holds for 1-2 candles, then snaps back inside the range. This is our favourite contrarian setup. Stop just beyond the failure wick, target the opposite end of the range. The historical edge: failed breakouts after a multi-week range tend to deliver the inverse move with conviction. The market has just stopped out the wrong side.
7. Engulfing reversal at a level
A large engulfing candle at a pre-defined support or resistance level, ideally with a long wick on the prior candle. Entry on the close of the engulfing bar, stop beyond the wick, target the next major level.
Without the level, an engulfing candle is just a candle. The level does the work.
How do we actually trade these?
- One pattern, one timeframe, for 50 trades. Mastery beats variety. The trader who knows exactly what a clean bull flag looks like on 4H ETH outperforms the trader who knows seven patterns at a surface level.
- Tag every trade with the pattern name in the journal. After 50 trades, the data tells you which patterns pay you and which do not.
- Wait for the close. Wicks lie. Closes confirm.
- Risk 1% per trade, fixed. Position size flexes off the stop, not the conviction.
What kills pattern trading
- Forcing patterns in low-volume sessions. The 03:00-06:00 UTC dead zone produces fake patterns daily.
- Ignoring the trend. A bull flag in a downtrend is a continuation pattern for the wrong direction.
- No volume filter. A breakout without volume is a stop-run, not a trend.
- Over-leverage. The pattern can be perfect and you can still take a 50% drawdown to the planned stop. Size accordingly.
Pattern trading at Volity
Volity offers MT4 and MT5 access on 20+ cryptocurrencies. Custom indicators, multi-timeframe charting, and saved templates let you scan the seven setups above across BTC, ETH, SOL, and majors in one workspace. Retail crypto leverage is capped at 1:2 under ESMA. Negative balance protection applies. Execution is by UBK Markets Ltd (CySEC 186/12).
Volity operates a trading platform and also publishes educational and analytical content about trading. The content on this page is for educational purposes only and should not be considered financial advice. Volity may benefit commercially when readers open trading accounts through links on this site.
Our content is produced and reviewed under documented editorial standards; comparison and review methodology is published here.
Frequently asked questions
Do crypto patterns work the same as in forex or stocks?
The geometry is the same because the underlying behaviour is the same, but crypto trades continuously and with thinner books outside major pairs. That produces more false breakouts and sharper wicks, so confirmation matters more than in a session-based market.
How reliable is a pattern on its own?
Not reliable enough to trade in isolation. A pattern is a description of where supply and demand have been, not a forecast. It becomes useful when combined with a level that matters, a volume change, and a predefined invalidation point.
Which timeframe suits crypto pattern trading best?
High timeframes filter more noise, so four-hour and daily charts produce fewer but cleaner signals than five-minute charts. Because crypto trades continuously, the daily close is an arbitrary point, and many traders anchor to a consistent session boundary instead.