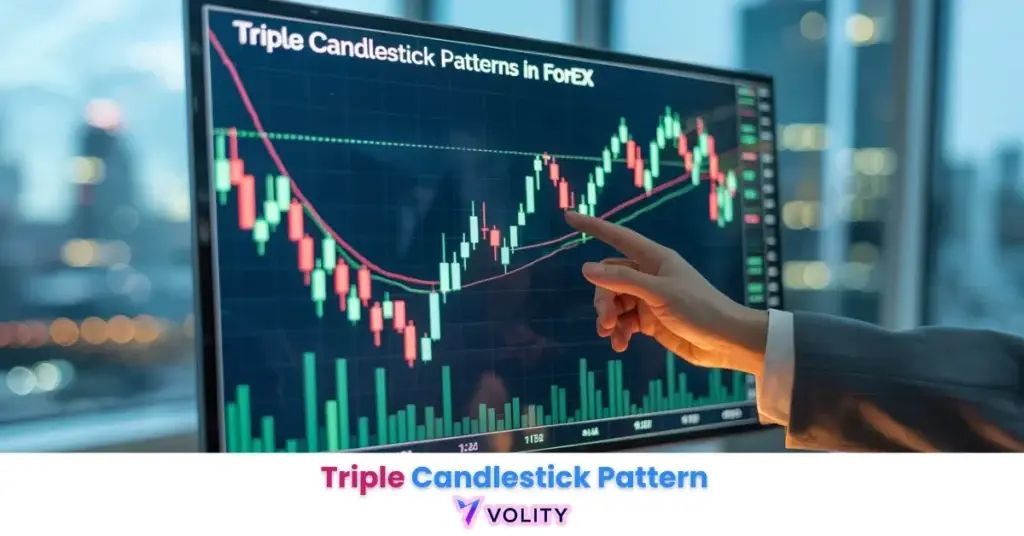
Triple candlestick patterns can generate false signals when volume fails to confirm the third candle; traders entering without a clear expansion in volume expose themselves to “fakeout” traps. Entering before the third candle closes exposes a trade to whipsaws during late-session liquidity hunts. Patterns forming during low-liquidity sessions show lower reliability despite appearing structurally sound, and an oversized three-candle formation can be followed by a sharp mean reversion. Past performance is not indicative of future results. Capital at risk.
A triple candlestick pattern is a three-bar price formation that signals a complete shift in market sentiment: impulse, indecision, and confirmation. Thomas Bulkowski’s tested statistics put the Three White Soldiers at a bullish reversal 82% of the time, which measures how often the pattern breaks out upward rather than how often a trade on it makes money. Professional strategies read these formations in context, at a level that already matters and with volume confirming the third candle.
A triple candlestick pattern functions as a comprehensive three-act narrative of market sentiment: the trend, the hesitation, and the reversal. These formations provide significantly more technical weight than single-candle signals because they require sustained commitment from buyers or sellers over multiple time intervals. In the 2026 technical landscape, they serve as the foundational markers for identifying institutional-grade entry points.
The effectiveness of these patterns is maximized when they coincide with major psychological levels and volume surges. As automated systems continue to arbitrage the most obvious chart patterns, mastering the nuances of volume price analysis (VPA) and EMA confluence is critical for verifying triple-candle validity.
While understanding Triple Candlestick Pattern is important, applying that knowledge is where the real growth happens. Create Your Free Forex Trading Account to practice with a free demo account and put your strategy to the test.
What is a triple candlestick pattern and how does it function?
A triple candlestick pattern is a three-candle price formation that identifies a complete sequence of market momentum shift or continuation. The pattern establishes a directional narrative that extends across three separate price bars, each with distinct meaning. These formations filter out the noise of single-candle “fakeouts” by requiring institutional-grade persistence.
- The Three-Act Structure: Impulse (Candle 1), Indecision (Candle 2), and Confirmation (Candle 3).
- Why a three-bar sequence carries more information than a single candle: it requires the move to persist across three closes.
- The shift from “Visual Identification” to “Statistical Validation” in algorithmic markets.
Triple candlestick patterns are widely used on 15-minute to 4-hour charts to filter out the high-frequency noise of 1-minute intraday charts. This timeframe selection ensures that the pattern’s signal reflects institutional flow rather than algorithmic noise.
The “Absorption” Signature in Reversal Formations
Price absorption identifies the institutional process where large limit orders exhaust the prevailing trend’s momentum during the second candle of a reversal pattern. The middle candle often displays a Doji or Spinning Top structure, indicating that neither bulls nor bears could establish control. Identifying Dojis and Spinning Tops as “Absorption Bars” separates retail recognition from professional understanding.
The role of volume-price divergence in 2026 reversals is critical. When price moves but volume fails to increase, the reversal lacks institutional backing. Conversely, when volume surges during the second candle’s formation, smart money is actively defending the support or resistance zone.
Ready to Elevate Your Trading?
You have the information. Now, get the platform. Join thousands of successful traders who use Volity for its powerful tools, fast execution, and dedicated support.
Create Your Account in Under 3 MinutesTop 2026 Triple Candlestick Patterns: Ranked by Success Rate
The figures below come from Thomas Bulkowski’s tested candlestick statistics. Each percentage is the share of occurrences that broke out in the pattern’s theoretical direction, measured across millions of candle lines. It is a direction statistic, not a win rate, and Bulkowski publishes a separate rank for how well price actually trends after the breakout:
- Three White Soldiers, bullish reversal 82%: requires each successive candle to open within the prior candle’s body. Bulkowski ranks post-breakout performance 32 of 103 and notes that price “does not trend all that well after the breakout”.
- Morning Star, bullish reversal 78%: a bearish bar, an indecision bar, then a bullish close back into the first body. Performance rank 12 of 103, the best of the group. The morning doji star is a separate pattern with its own statistics.
- Mat Hold, bullish continuation 78%: a brief bearish intrusion inside an uptrend. The direction share is high but the pattern is very rare, and Bulkowski ranks post-breakout performance 86 of 103, near the bottom of the table.
- Evening Star, bearish reversal 72%: the mirror image at a market top. Performance rank 4 of 103, so when it does break down, price tends to keep going.
- Three Inside Up, bullish reversal 65%: a harami followed by a confirming close. Far more common than the others in this list, with a performance rank of 20 of 103. Its bearish twin, the Three Inside Down, reverses only 60% of the time.
Confluence is a real idea and an unquantified one: a pattern that forms at a level the market has already respected is easier to justify than the same shape in open space, but no published test attaches a specific percentage uplift to it. Treat the moving average as context, not as a multiplier. Bulkowski on Candlestick Patterns publishes the tested figures for every pattern named on this page, and Japanese Candlestick Patterns provides deeper historical context.
Always wait for the third candle of a triple pattern to close decisively before entering. A pattern that has not closed is not a pattern, and a “developing” shape can still resolve the other way inside the final minutes of the session.
How to trade the Morning Star: A 2026 Step-by-Step Guide
A common professional filter for the Morning Star is a clear expansion in volume on the third candle together with an RSI recovery from oversold levels. This structured approach prevents emotional entries and filters out the false signals that plague retail traders. The pattern’s three-step confirmation process ensures institutional participation before capital is committed.
The 4-Step Playbook guides execution:
- Context: the pattern must form at a level the market has already respected, not in open space.
- Candle 2: Identifying the “Doji” or “Spinning Top” that gaps away from Candle 1, signaling indecision.
- Entry: Placing a buy-stop order 3 pips above the high of the third candle, capturing momentum confirmation.
- Stop-Loss: Using the ATR-anchored method below the low of the pattern, scaling with current volatility.
Worked illustration of the rule rather than a record of a trade: price falls into a level it has respected before, the second bar prints a doji, the third closes back above the first body on visibly heavier volume, and the entry sits above the third candle’s high with the stop below the pattern low. Past performance is not indicative of future results.
The Role of Volume Confirmation in 2026 Pattern Validity
Volume confirmation identifies the ‘Effort vs. Result’ relationship needed to distinguish real participation from a fakeout. A pattern lacking volume shows traders reacting to price; a genuine reversal needs active buying or selling behind it. There is no published threshold that separates the two, so read volume relative to the same instrument’s own recent average rather than against a fixed multiple.
| Pattern | Bulkowski tested direction | Frequency rank (of 103) | Performance rank (of 103) |
| Three White Soldiers | Bullish reversal 82% | 67 | 32 |
| Morning Star | Bullish reversal 78% | 66 | 12 |
| Evening Star | Bearish reversal 72% | 71 | 4 |
| Three Inside Up | Bullish reversal 65% | 31 | 20 |
| Three Inside Down | Bearish reversal 60% | 33 | 56 |
Tested figures from Bulkowski on Candlestick Patterns. Rank 1 is best in both columns. A high direction share and a poor performance rank together mean the pattern usually breaks the expected way and then goes nowhere.
WARNING: Beware of triple patterns that form on declining volume. A Morning Star or Evening Star whose third candle arrives on lighter volume than the two before it has no participation behind the reversal, and the prior trend frequently resumes.
Difference Between Reversal and Continuation Triple Patterns
Structural location identifies whether a triple candlestick pattern serves as a reversal of a prior trend or a confirmation of its continuation. The context surrounding the pattern determines its interpretation more than the candle structure itself. Professional traders recognize that the same three-candle sequence can be bullish or bearish depending on where it appears.
Reversal Patterns like the Morning Star, Evening Star, and Abandoned Baby signal trend death when they appear at extremes. These patterns mark exhaustion points where the prevailing direction has run out of buyers or sellers. Continuation Patterns like Three White Soldiers, Rising Three Methods, and Mat Hold signal trend strength during value pullbacks. These patterns show that a brief consolidation is ending and momentum is resuming in the original direction.
When to prioritize each depends on market structure. Trend Line Analysis helps identify when price has established clear extremes versus temporary pullbacks.
💡 KEY INSIGHT: The Mat Hold breaks out upward 78% of the time, which is a high direction share, but it is one of the rarest patterns in Bulkowski’s database and ranks 86 of 103 for what price does afterwards. A high direction share and a weak follow-through are not the same thing.
Turn Knowledge into Profit
You have done the reading, now it is time to act. The best way to learn is by doing. Open a free, no-risk demo account and practice your strategy with virtual funds today.
Open a Free Demo AccountCommon Mistakes: The “Premature Entry” Trap
Premature execution is the most common way traders lose money on these formations: entering before the third ‘confirming’ candle has closed. Many retail traders chase the pattern as it develops, entering on the second candle or during the formation of the third candle. This impatience costs money because the third candle frequently reverses during the final 5 minutes of the session.
Chasing the “Developing” Star, entering before the third candle closes, violates the fundamental rule of pattern trading. The third candle must close decisively above (for bullish) or below (for bearish) the prior range for confirmation. Ignoring the Macro Backdrop amplifies losses because trading a bullish reversal into a major monthly resistance zone often fails due to overhead supply. Risk Management in Trading and Forex Technical Analysis both address how to layer macro context into your technical entries.
Key Takeaways
- Triple candlestick patterns are high-conviction formations that require a three-bar sequence to identify a complete shift in market momentum.
- The Three White Soldiers breaks out upward 82% of the time in Bulkowski’s tests, but ranks only 32 of 103 for how far price travels afterwards.
- Morning Star formations identify market bottoms through a sequence of a bearish impulse, an indecision candle, and a bullish confirmation.
- Volume expansion on the third candle is what separates a confirmed pattern from a fakeout; read it against the instrument’s own recent average rather than a fixed multiple.
- H4 and Daily timeframes provide the most reliable signals for triple patterns, filtering out the noise of lower-timeframe liquidity hunts.
- Wait for the close is the mandatory rule for triple pattern trading, because an unclosed third candle can still resolve against the pattern.
Frequently Asked Questions
This article contains references to Triple Candlestick Pattern, Morning Star, Three White Soldiers, and Volity, a regulated CFD trading platform. This content is produced for educational purposes only and does not constitute financial advice or a recommendation to buy or sell any financial instrument. Always verify current regulatory status and platform details before using any trading service. Some links in this article may be affiliate links.