The Accumulative Swing Index (ASI) is a technical analysis tool developed by J. Welles Wilder Jr. that aims to provide a more accurate depiction of a market’s true underlying trend. It factors in opening, high, low, and closing prices, adjusting for gaps and limiting daily swing to filter out market noise. Traders use ASI to confirm trends, identify potential reversals through divergence, and gain deeper insights into market sentiment.
While understanding Accumulative Swing Index Asi is important, applying that knowledge is where the real growth happens. Create Your Free Forex Trading Account to practice with a free demo account and put your strategy to the test.
What is the Accumulative Swing Index (ASI)?
The Accumulative Swing Index (ASI) is a specialized technical indicator that measures the “true” market price movement, filtering out insignificant daily fluctuations to reveal the underlying trend. Unlike simple momentum indicators, ASI considers the prior day’s close and the current day’s open, high, low, and close, providing a nuanced view of market sentiment and strength.
This unique calculation considers the relationship between the current day’s price action and the previous day’s closing price, effectively smoothing out volatility and highlighting significant shifts. By focusing on these comprehensive price points, ASI attempts to reveal the genuine market sentiment and directional bias.
J. Welles Wilder Jr.’s Vision
The Accumulative Swing Index (ASI) was developed by J. Welles Wilder Jr., a highly influential figure in technical analysis, and was first introduced in his seminal 1978 book, ‘New Concepts in Technical Trading Systems.’
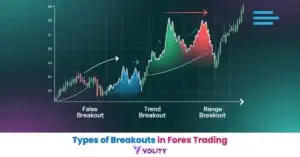
Wilder’s vision was to create an indicator that could accurately reflect the market’s true intra-day price movement, minimizing the impact of false breakouts and daily noise. He is also credited with developing other widely used indicators such as the Relative Strength Index (RSI) and the Average Directional Index (ADX).
💡 KEY INSIGHT: Many traders often ask if ASI is just another momentum indicator. While it reflects momentum, its unique “accumulative” nature and adjustment for gaps make it more akin to a trend-following indicator that aims to reveal the true directional force, rather than just the speed of price change.
How the Accumulative Swing Index (ASI) is Calculated
The Accumulative Swing Index (ASI) is the running total of a component called the Swing Index (SI). Understanding the calculation of the Swing Index is fundamental to grasping how ASI provides its unique insights into market trends.
At its core, the calculation breaks down the daily price action into a single value that represents the day’s “swing.” This value is then accumulated over time, forming the continuous line of the ASI.
Building Block of ASI
The Swing Index is the primary building block of the Accumulative Swing Index. Its calculation involves comparing the current day’s price action (high, low, close) to the previous day’s close and the current day’s open.
A crucial component of the Swing Index calculation is the True Range, which accounts for the maximum of three values: the current high minus the current low, the absolute difference between the current high and the previous close, and the absolute difference between the current low and the previous close. This ensures that volatility, including gaps, is fully captured. The Swing Index formula then normalizes this True Range, creating a value that is less susceptible to extreme daily price spikes.
From SI to ASI
The Accumulative Swing Index (ASI) is simply the running total of the daily Swing Index values. Each day’s calculated Swing Index is added to the previous day’s ASI value, creating a continuous line that tracks the market’s underlying trend.
This accumulation process helps to smooth out short-term fluctuations and makes it easier to identify the persistent direction of the market. When the ASI line is trending upwards, it suggests a bullish underlying trend, while a downward-sloping line indicates a bearish trend.
Understanding the ‘Limit Move’ (R Factor)
The ‘Limit Move’ or R factor is a critical, yet often misunderstood, component in Welles Wilder’s original Swing Index formula. This factor acts as a normalization constant, preventing extreme daily price fluctuations from distorting the Swing Index value.
It is typically set to a user-defined value that represents the maximum expected daily price change or volatility for a given asset. By limiting the daily swing, the R factor ensures that the indicator remains stable and provides consistent signals, even during periods of high volatility or significant price gaps. Essentially, it smooths the data, making the ASI more reliable for identifying underlying trends rather than reacting to every sharp, but potentially temporary, price spike.
Ready to Elevate Your Trading?
You have the information. Now, get the platform. Join thousands of successful traders who use Volity for its powerful tools, fast execution, and dedicated support.
Create Your Account in Under 3 MinutesHow to Trade the Accumulative Swing Index (ASI)
Interpreting the Accumulative Swing Index (ASI) involves recognizing how its movements correlate with, or diverge from, price action to generate trading signals and confirm trends. The indicator’s primary utility lies in its ability to filter market noise, allowing traders to see the genuine directional bias.
By observing ASI’s interaction with previous swing points on the chart, traders can gain confidence in the current trend’s strength or anticipate potential reversals. This often involves looking for specific patterns or breakouts in the ASI line itself, rather than solely focusing on price.
ASI and Price Crossover Signals
A common interpretation of ASI is to look for the index to break above or below previous swing highs or lows, which often precedes price doing the same, acting as a leading indicator of trend confirmation.
When the Accumulative Swing Index (ASI) breaks above its own prior swing high, it suggests that the underlying buying pressure is strong enough to push prices higher, often confirming a bullish trend. Conversely, a break below a prior ASI swing low indicates increasing selling pressure, confirming a bearish trend.
These crossover signals are particularly powerful when they occur before or in conjunction with similar breaks in price action, providing an early warning or validation of market direction.
Identifying Bullish and Bearish Divergence
Divergence between the ASI and price action is considered a strong signal of potential trend reversal. This is a critical application that often raises questions among users, such as “How do I know if it’s a true divergence or a false signal?”
- Bullish Divergence: Occurs when price makes a lower low, but the Accumulative Swing Index (ASI) makes a higher low. This suggests that despite price falling, the underlying selling pressure is weakening, hinting at a potential upward reversal.
- Bearish Divergence: Occurs when price makes a higher high, but the ASI makes a lower high. This indicates that buying pressure is diminishing, even as price rises, signaling a potential downward reversal.
To address the concern about false signals, traders often wait for price action confirmation, such as a breakout above a trendline or a reversal candlestick pattern, after a divergence signal. This additional confirmation helps to validate the ASI’s early warning.
| Divergence Type | Price Action | ASI Action | Implication |
| Bullish | Lower Low | Higher Low | Potential Up Reversal |
| Bearish | Higher High | Lower High | Potential Down Reversal |
Using ASI with Support and Resistance
The Accumulative Swing Index (ASI) can significantly improve the effectiveness of identifying Support and Resistance levels in Price Action. When price approaches a key support level, a bounce in the ASI can confirm the strength of that support, indicating that buying pressure is absorbing selling interest.
Conversely, if price breaks below a support level, a corresponding break in the ASI can validate the breakout, suggesting that the move is genuine and not a false signal. Similarly, at resistance levels, a rejection by the ASI confirms selling pressure, while a break above it signals strong buying.
Combining with Other Indicators & Strategies
Integrating the Accumulative Swing Index (ASI) into a broader trading strategy is essential, as no single indicator provides a complete picture of the market. Many traders struggle with how to combine ASI effectively with other tools.
- The key is to use ASI as a confirmatory or early warning indicator, complementing the insights provided by other technical analysis tools.
- This multi-indicator approach helps to filter out false signals and build higher-conviction trading setups.
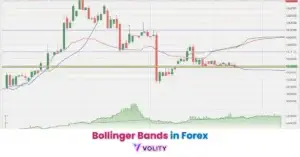
- For example, using ASI to confirm trends identified by moving averages or to validate reversal signals from candlestick patterns can significantly improve signal reliability.
- This strategic combination transforms ASI from a standalone tool into a powerful component of a robust market analysis framework.
A Comparative Analysis
The Accumulative Swing Index (ASI) and the Relative Strength Index (RSI) are both popular indicators developed by Welles Wilder, yet they serve different purposes. While RSI is a momentum oscillator measuring the speed and change of price movements, ASI aims to reveal the “true” underlying trend by accumulating daily swings and adjusting for gaps.
| Feature | Accumulative Swing Index (ASI) | Relative Strength Index (RSI) |
| Developer | J. Welles Wilder Jr. | J. Welles Wilder Jr. |
| Primary Goal | True trend direction | Momentum, overbought/oversold |
| Calculation Basis | Open, high, low, close, prior close | Average gains vs. losses |
| Signal Type | Trend confirmation, divergence | Reversal, overbought/oversold |
| Range | Unbounded | 0-100 |
| Use Case | Trend following, early trend breaks | Short-term reversals, momentum |
ASI’s unbounded nature and focus on daily swings make it better suited for confirming longer-term trends and anticipating breakouts. RSI, conversely, excels at identifying short-term overbought/oversold conditions and potential reversals within a defined range. They can complement each other, with ASI confirming the larger trend and RSI pinpointing short-term entry or exit points.
Optimal ASI Settings and Timeframe Considerations
Many traders struggle with the subjective nature of identifying significant swing points and applying optimal indicator settings, leading to inconsistent results. Optimal settings are highly dependent on the specific market, asset, and timeframes being analyzed, as well as the trader’s individual trading strategy.
Traders often find that ASI works best on higher timeframes, such as daily or weekly charts, where the “true” trend is more pronounced.
MA, Volume, and Candlesticks
The Accumulative Swing Index (ASI) truly shines when combined with Moving Averages (MA), Volume, and Candlestick Patterns. For example, traders can use a Moving Average to define the overall trend direction, only taking ASI buy signals when price is above a key MA and ASI confirms the upward momentum.
Volume can provide further confirmation for ASI signals; a breakout confirmed by ASI with high volume suggests a stronger, more reliable move. Conversely, a divergence signal from ASI on low volume might be less convincing.
Candlestick Patterns, such as engulfing patterns or hammers, can offer precise entry and exit points, especially when validated by ASI’s trend confirmation or divergence signals. This layered approach helps to build higher-probability trading setups by cross-referencing multiple sources of market information.
Limitations of ASI and Common Pitfalls to Avoid
While the Accumulative Swing Index (ASI) is a powerful tool for technical analysis, it is not without limitations. No single indicator can perfectly predict market movements, and relying solely on ASI can lead to common pitfalls. Traders must understand these constraints to avoid misinterpretations and manage risk effectively.
A common pitfall is over-reliance on any single signal, especially in volatile or choppy markets where indicators can generate false positives.
Lagging Nature and False Signals
Despite its aim to provide a leading indication of trend confirmation, the Accumulative Swing Index (ASI) can still exhibit a lagging nature, particularly in fast-moving or rapidly changing markets. While it seeks to filter noise, it processes past price data, meaning it reacts to events rather than predicting them.
This can lead to false signals, especially in choppy or sideways markets where a clear trend is absent. In such conditions, ASI might generate frequent, conflicting signals that do not translate into sustained price movements.
Subjectivity in Interpretation
One of the limitations of the Accumulative Swing Index (ASI) is the inherent subjectivity in its interpretation, particularly when identifying significant swing points for divergence or price action confirmation. Many traders struggle with the subjective nature of identifying optimal indicator settings and significant swing points, leading to inconsistent results.
What one trader considers a clear swing high or low on the ASI, another might view differently. This subjectivity can lead to varied trading decisions based on the same chart data. For instance, pinpointing the exact moment a divergence is “true” versus a minor fluctuation requires experience and discretion, which can be a barrier for newer traders.
The Critical Role of Risk Management
The critical role of Risk Management cannot be overstated when using any trading strategy, including those involving the Accumulative Swing Index (ASI). Even strong signals like divergence do not guarantee profitability. Proper risk management, which includes setting appropriate stop-loss orders, calculating position sizes based on a fixed percentage of capital (e.g., 1-2% per trade), and diversifying investments, is paramount.
These measures protect capital against false signals, unexpected market moves, and the inherent uncertainties of trading.
Advanced Applications & Unconventional Insights
While the Accumulative Swing Index (ASI) is a classic tool, its true potential in modern markets lies in its objective integration into algorithmic strategies and a deep understanding of the psychological biases it can expose or mitigate.
This section aims to bridge that gap, offering pragmatic solutions and unique insights into ASI’s relevance in today’s complex trading landscape.
Integrating ASI into Algorithmic Trading Systems
The objective nature of the Accumulative Swing Index (ASI) makes it highly suitable for Algorithmic Trading Integration. Traders can program precise rules for signal generation, entry, exit, and Risk Management based on ASI’s movements.
For example, an algorithm could be set to buy when ASI breaks a previous swing high and price confirms, with a stop-loss triggered if ASI breaks below a certain level.
The importance of robust Backtesting cannot be overstated here; sophisticated algorithms require advanced backtesting techniques, such as walk-forward optimization or Monte Carlo simulations, to validate ASI strategies across various market conditions.
The Psychology of Accumulative Swing Index Interpretation
While indicators like the Accumulative Swing Index (ASI) are technical tools, their interpretation is inherently human, making them susceptible to Psychological Biases.
Confirmation bias, for example, can lead traders to selectively see ASI signals that support their existing market view, ignoring contradictory evidence. Recency bias might cause traders to overemphasize recent ASI performance, neglecting its historical behavior. Understanding these biases is crucial for objective Technical Analysis.
By being aware of how emotions and cognitive shortcuts can distort ASI signals, traders can cultivate a more disciplined approach, focusing on objective rules and confirmation.
Turn Knowledge into Profit
You've done the reading, now it's time to act. The best way to learn is by doing. Open a free, no-risk demo account and practice your strategy with virtual funds today.
Open a Free Demo AccountSoftware, Resources & Next Steps
Getting started with the Accumulative Swing Index (ASI) involves selecting the right charting platform and understanding how to implement the indicator effectively. Many traders often ask, “How to add ASI to TradingView?” and “What software supports ASI?”
Fortunately, ASI is widely available on most professional and retail trading platforms, making it accessible to a broad audience.
Adding ASI to Your Charting Platform (TradingView, MetaTrader, etc.)
Adding the Accumulative Swing Index (ASI) to popular charting platforms like TradingView, MetaTrader 4/5, Thinkorswim, NinjaTrader, and cTrader is generally a simple process. Most platforms include ASI as a built-in indicator.
To add it, typically navigate to the “Indicators” or “Studies” menu, search for “Accumulative Swing Index” or “ASI,” and then apply it to your chart. You will usually have options to adjust its parameters, such as the lookback period and the ‘limit move’ (R factor).
TradingView, for instance, allows users to quickly find and apply ASI from its comprehensive indicator library, often with customizable colors and lines. Familiarizing yourself with your platform’s specific interface for adding and customizing indicators is the first step to using ASI in your analysis.
Is the Accumulative Swing Index Profitable? Realistic Expectations
The question “Is the Accumulative Swing Index (ASI) profitable?” is common, but it’s essential to set realistic expectations. No single indicator, including ASI, guarantees profitability on its own. Profitability in trading stems from a well-defined trading strategy, robust Risk Management, consistent execution, and continuous learning.
ASI is a powerful tool for identifying true market direction and potential reversals, but it must be used in conjunction with other forms of analysis and a comprehensive plan.
Bottom Line
The Accumulative Swing Index (ASI), developed by J. Welles Wilder Jr., stands out as a sophisticated technical indicator designed to uncover the true underlying trend of a market.
By meticulously factoring in opening, high, low, and closing prices, and adjusting for gaps, it provides a clearer picture of market direction, filtering out the noise that often obscures genuine momentum.
Traders leverage ASI for robust trend confirmation, identifying potential reversals through divergence, and improving their understanding of price action around key support and resistance levels. While powerful, its effective application necessitates integration with other indicators and a strong emphasis on risk management.
Furthermore, understanding its advanced applications in algorithmic trading and recognizing psychological biases in interpretation can unlock its full potential for modern traders.
Key Takeaways
- The Accumulative Swing Index (ASI) reveals true market direction by filtering noise.
- It was developed by J. Welles Wilder Jr., the creator of RSI and ADX.
- Divergence between ASI and price is a strong signal for potential reversals.
- ASI should always be combined with other indicators and risk management.
- Its potential extends to algorithmic trading and understanding psychological biases.