Investing in financial products involves risk. Losses may exceed the value of your original investment.
Bitcoin etf inflows is a core topic for traders in 2026. The complete guide follows.
Crypto markets brace for volatility amid ETF inflows and geopolitical jitters
Bitcoin traded like a market with two minds on Tuesday. On one side sat steady ETF demand and a fresh scarcity milestone. On the other sat a crude oil shock and a CPI print that could reprice every risky asset by lunchtime.
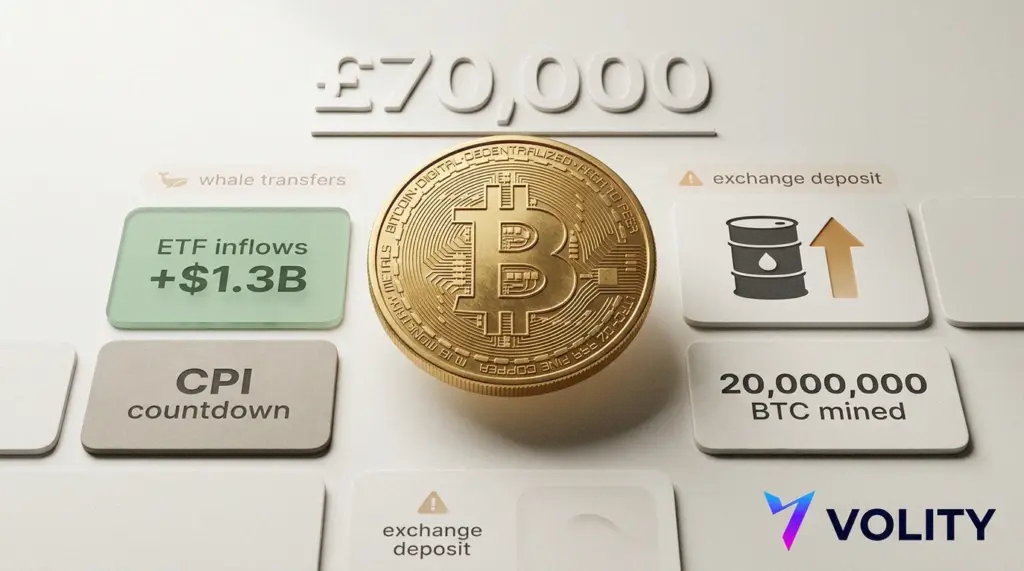
Bitcoin’s flirtation with $70,000 looked less like a victory lap and more like a test of patience. Spot Bitcoin ETFs pulled in more than $1.3 billion of net inflows over recent sessions, therefore giving spot buyers a reliable bid. However, derivatives traders eased off the accelerator, with open interest falling across major exchanges. That mattered, because lighter leverage often means fewer forced liquidations when headlines hit.
Meanwhile, the network crossed a psychological line: more than 20 million bitcoins have now been mined. Only about 1 million and change remain, and the pace slows over time. That supply story tends to sound abstract, yet it becomes very real during a macro wobble, when scarcity narratives compete with cash yields and energy prices.
Still, not all flows looked like long only conviction. On chain watchers noted Bhutan-linked wallets shifting roughly $11 million in Bitcoin. Elsewhere, a large Ethereum transfer, about 9,600 ETH, moved towards Coinbase Prime, therefore reviving the familiar question of whether treasury or early holder selling would meet the next bounce.
However, the bigger swing factor sat outside crypto. Oil jumped hard on renewed tension around Iran and shipping routes, with traders again talking about the Strait of Hormuz. Higher crude feeds inflation expectations, therefore raising the bar for a risk rally. With US CPI due tomorrow, crypto’s calm could evaporate quickly.
Bitcoin: a cleaner tape, but a harder level
Price action has been constructive, with traders watching a bullish channel and repeated probing of the $70,000 area. Yet the more times a market taps resistance, the more it advertises that level to systematic sellers. Therefore, a clean break may need a macro tailwind, not just crypto specific hope.
Corporate accumulation stayed in the spotlight. MicroStrategy added 1,360 BTC in one reported purchase, while another buyer was cited for a roughly $1.28 billion grab, about 17,994 coins. Those numbers sound like fireworks, yet the market cares about follow-through, not headlines.
Meme coins: charts first, fundamentals later
Meanwhile, meme coins returned to their natural habitat: loud price action on thin evidence. Dogecoin traders circulated a rare technical setup that targets a move towards $0.15, roughly 50% above the levels many were watching. However, there is still no Dogecoin ETF, and the token remains a sentiment proxy rather than an adoption story.
Shiba Inu also drew bargain hunters, while dog themed tokens such as WIF flashed oversold divergences that often appear near short term bottoms. Pudgy Penguins’ ecosystem push helped lift PENGU, therefore adding another chapter to the “IP driven meme” trade.
XRP, Solana and Ethereum: institutions circle, but the tape decides
XRP held firm around the $1.30 area as traders watched a symmetrical triangle pattern. Ripple’s management talked up longer term priorities, and stablecoin supply growth fed the utility narrative. However, the market continues to treat XRP as a headline asset, therefore making support and liquidity more important than speeches.
Solana’s institutional bid stayed in focus, with about $540 million tied to reported ETF related activity across a wide group of buyers. Ethereum, by contrast, remained pinned between roughly $1,900 and $2,200. Staking continues to climb, yet the market still debates whether the recent churn is capitulation or just a pause before another leg down.
DeFi, AI and the background noise that can still move prices
In the riskier corners, the DeFi and AI crossover trade kept throwing out new tokens, new partnerships and familiar bravado. TRON DAO joined an Agentic AI group as a governance member, while stablecoin projects promised treasury backing and payments relevance. However, those stories rarely matter on CPI week, when liquidity tightens and correlations rise.
What traders are watching next
For now, crypto sits in the uncomfortable middle ground. ETF inflows and corporate buying support the dip. However, oil, inflation surprises and positioning will decide whether $70,000 becomes a base or a ceiling.
By the numbers
- 20,000,000+ bitcoins mined, with roughly 1.3 million left.
- $1.3 billion+ of recent net inflows into spot Bitcoin ETFs.
- 1,360 BTC added in a single MicroStrategy purchase.
- 17,994 BTC cited in a separate $1.28 billion buy.
- 9,600 ETH moved to Coinbase Prime in one tracked transfer.
Key takeaways
- Lower open interest suggests a cleaner market, therefore fewer liquidation cascades on bad news.
- $70,000 on Bitcoin remains the pivot; a CPI driven risk move can force the break or the rejection.
- Oil volatility can drown out crypto narratives, therefore keep position size honest into data.
- Meme coins may run on patterns and flow, but they tend to gap both ways on macro shocks.
- ETH’s $1,900 to $2,200 range is the near term battlefield; options hedging can amplify moves on exit.
For more on this topic see our deep-dives on Bitcoin Price Drivers: Fed Decisions, Whale Moves and ETF Flows, Bitcoin Price and Morgan Stanley ETF Inflows: What Traders Track, and Bitcoin ETF Inflows and Crypto Rallies: Reading the Signal.
What our analysts watch: Three lenses dominate our reading of the equity tape. Sector rotation tells us where capital is moving (defensives versus cyclicals, value versus growth). Earnings revisions show whether analyst expectations are catching up to or trailing reality. Real yields and the dollar set the discount rate that valuation multiples respond to. When earnings estimates rise faster than the index price and real yields stabilise, the setup tends to favour patient longs.
Frequently asked questions
How much money do I need to start trading stocks?
Many regulated brokers now allow account opening with no minimum deposit and offer fractional shares for as little as $1. A practical starting balance for a long-only beginner is $500 to $2,000, enough to diversify across a handful of positions without paying meaningful percentage spreads. The FCA publishes investor education resources worth reading before opening an account.
What is the difference between stocks, ETFs, and CFDs?
A stock is direct ownership in a company. An ETF is a basket of stocks (or other assets) traded as a single security. A CFD (contract for difference) is a leveraged derivative that tracks the underlying price without conferring ownership. Each has different cost, tax, and risk profiles. ESMA imposes leverage caps on retail CFDs in the EU and UK.
How do I choose a trustworthy broker?
Verify regulation with a tier-one authority (FCA in the UK, CySEC in Cyprus, BaFin in Germany, ASIC in Australia, or your local regulator). Check segregated client funds, negative-balance protection, transparent fees, and a clean disciplinary record. Avoid any platform offering guaranteed returns or pressuring deposits. The FCA Financial Services Register is free to search.
Should I day-trade or invest long-term?
Most retail accounts that day-trade lose money over time. Long-term passive investing in diversified index ETFs has historically delivered competitive returns with far less effort and lower stress. Active day-trading can work, but it requires capital, an edge proven over hundreds of trades, and the time to monitor positions intraday. Start passive; layer active only after the basics are durable.
Related guides
- Bitcoin explained
- Cryptocurrency trading
- Crypto trading platforms
- Best crypto investments
- Risk management
Alexander Bennett, Volity research: The Volity desk runs a CPI playbook on every release date. Step one is the surprise direction, measured against the consensus median rather than the prior print. Step two is the rates reaction in the first thirty minutes, because that prices the regime change. Step three is the BTC spot reaction over the next four hours, with ETF flow data confirming whether the move is positioned or reactive. When net flows confirm the price direction, the move is durable. When they diverge, the move is fading and the fade is the trade.
Volity analyst FAQ
How does CPI move Bitcoin price?
CPI prints reset rates expectations, which reprice every risk asset including BTC through the dollar liquidity channel. A hotter-than-expected print pushes yields higher and pressures crypto; a cooler print eases yields and supports it. The transmission runs in minutes, not days. The Bank of England monetary policy page tracks the macro overlay.
What do spot Bitcoin ETF inflows of one billion dollars actually mean?
Multi-day net inflows above one billion dollars indicate sticky institutional bid that absorbs daily issuance and existing-holder supply at scale. The signal compounds when the inflows persist through volatility windows rather than only during calm tape. Single-day prints are noise; multi-week trends are the structural anchor. The CoinDesk Bitcoin reference contextualises flow against price.
Why does Bitcoin sometimes rally on bad inflation data?
The counterintuitive rally happens when the print confirms a path toward future easing or signals macro stress that drives investors into scarce assets. The relationship is regime-dependent: in late-cycle disinflation, BTC tends to track yields inversely; in stagflation regimes, BTC can decouple. The Investopedia CPI primer covers the canonical interpretation framework.
Should I trade Bitcoin around CPI release windows?
CPI windows compress weeks of price discovery into minutes. The honest framing is that retail accounts trading around the print face wider spreads, faster slippage, and elevated liquidation risk. Most professional desks scale exposure down into the print and re-engage after the rates reaction is priced. Position sizing through the window matters more than directional conviction.
External references
- Bank of England monetary policy
- CoinDesk Bitcoin price
- Investopedia CPI primer
Volity operates a trading platform and also publishes educational and analytical content about trading. The content on this page is for educational purposes only and should not be considered financial advice. Volity may benefit commercially when readers open trading accounts through links on this site.
Our content is produced and reviewed under documented editorial standards; comparison and review methodology is published here.