Investing in financial products involves risk. Losses may exceed the value of your original investment.
Bitcoin price fed is a core topic for traders in 2026. The complete guide follows.
Crypto markets brace for Fed day amid whale moves and institutional surge
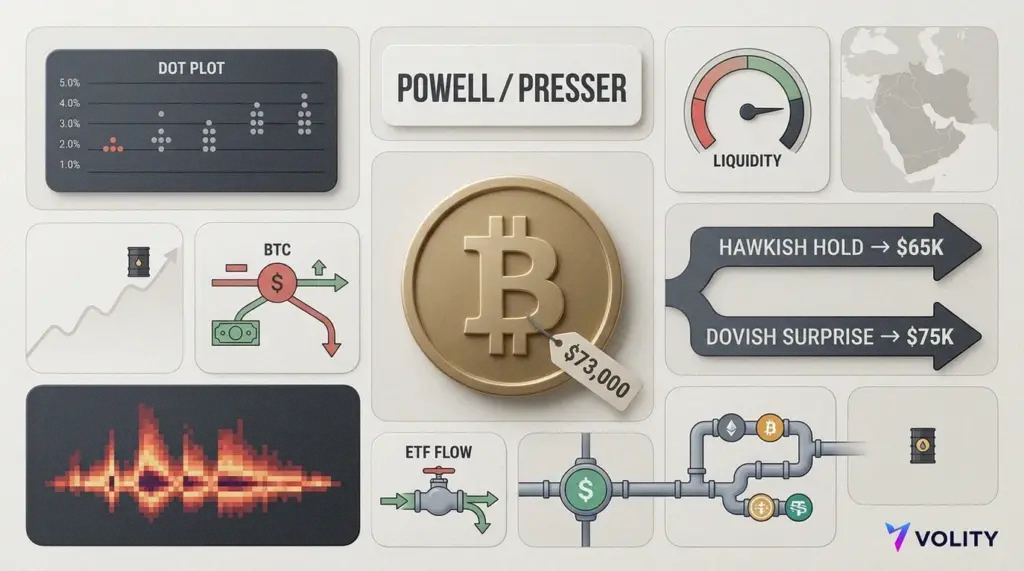
Bitcoin slipped below $73,000 on Wednesday as traders waited for the Federal Reserve’s rate decision and Chair Jerome Powell’s press conference. Meanwhile, oil prices firmed again as tensions around the Strait of Hormuz kept energy risk in play. Therefore, the day felt less like a crypto story and more like a global macro tape in a Bitcoin wrapper.
The set up is simple. Traders expect the Fed to hold rates, yet they fear the dot plot and Powell’s tone. However, crypto rarely trades the decision itself. It trades the second order message on growth, inflation and liquidity, plus any hint of a policy mistake.
Fed under the microscope as traders map a $65,000 pullback
Markets broadly expect no change in the policy rate at this meeting. Even so, the forward path matters more than the level, because risk assets have priced a gentler 2026. If Powell signals fewer cuts, Bitcoin could revisit its spring congestion zone.
Core inflation remains sticky, while energy prices have lifted the headline risk again. Consequently, a hawkish hold can land like a hike in digital terms, because leverage sits close to the surface. In recent Fed events, Bitcoin has often sold first and asked questions later, particularly when positioning leaned long.
- Hawkish read through: fewer cuts implied, higher for longer language, and risk assets de rate. Therefore, BTC drifts towards $65,000 and altcoins underperform.
- Base case: hold plus cautious confidence. However, an initial dip towards $70,000 to $72,000 can still reverse if rates volatility cools.
- Dovish surprise: clearer opening for cuts. Meanwhile, BTC can re test $75,000 quickly and squeeze short futures.
Derivatives traders are watching liquidation levels and the clustering of stop orders near recent highs. Although those estimates vary by venue, the message is consistent. Leverage can amplify a modest headline into a fast move, especially within the first hour after the statement.
Institutional money keeps coming, even as macro wobbles
While retail chatter fixates on the next candle, institutions keep building rails. Surveys circulating across the industry show a large majority of professional investors plan to increase crypto exposure. That matters because, unlike the 2021 cycle, the incremental buyer now includes allocators with quarterly pacing and investment committees.
Spot Bitcoin ETFs have remained the clearest channel. Flows have steadied after earlier surges, yet the presence of a daily liquidity valve changes the texture of sell offs. Meanwhile, Ethereum’s own institutional narrative remains tied to its ETF complex and the on chain treasury bill trade.
Stablecoins have also moved from niche tooling to corporate plumbing. Therefore, venture funding has shifted towards payments, settlement and tokenised real world assets. Tokenisation remains small compared with mainstream markets, yet it is growing from a low base, with private credit and Treasury like instruments leading activity.
Whales and headlines jolt a market that already feels crowded
Large wallets have continued to move size through major exchanges, and traders have tracked several high conviction short bets that have worked in recent weeks. Meanwhile, politically themed tokens have kept their habit of ignoring gravity, rallying on rumour and social buzz.
Regulation remained a two sided driver. On one hand, officials have signalled a more permissive stance towards certain parts of the market. On the other hand, policymakers outside the United States have floated restrictions tied to foreign influence and capital controls. Consequently, global liquidity for some tokens can still fragment quickly.
Security risk also returned to the foreground. Hack reports and wallet hygiene failures have again reminded investors that custody is not a footnote. Therefore, any rally into thin summer liquidity can fade fast if confidence takes a hit.
DeFi and infrastructure push forward, regardless of the Fed
Ethereum and the broader DeFi stack have kept iterating. Treasuries are experimenting with on chain yield, and developers are still optimising confirmation times and user experience. Meanwhile, layer 2 networks continue to chase lower fees and higher throughput, with total value locked and transaction counts rising in bursts.
Payments infrastructure is also inching into the real economy. Partnerships between crypto platforms and mainstream processors have aimed at tourists, merchants and cross border settlement. However, adoption remains uneven, because banks can still slow ramps and off ramps when risk committees turn cautious.
What traders are watching after the statement
The first move after the Fed will matter less than the second. Therefore, traders will watch whether Bitcoin can reclaim the low $73,000s and hold it into New York’s close. If it fails, the chart can pull price back towards the low $70,000s, where spot demand has previously shown up.
- By the numbers: BTC below $73,000 ahead of the Fed statement.
- Key level: $70,000 to $72,000 as the first support band traders cite.
- Risk level: $65,000 as the deeper pullback scenario under hawkish pricing.
- Watch list: Coinbase and other crypto equities as a high beta read through.
- Key takeaways: keep position sizes small into the press conference, because volatility can gap through stops.
- Key takeaways: wait for the post statement retrace before chasing, since the first candle often lies.
- Key takeaways: if ETFs keep absorbing supply, dips may remain shorter than traders expect.
- Key takeaways: treat whale flows as colour, not gospel, yet respect them in thin liquidity.
For more on this topic see our deep-dives on Bitcoin Drops as Tether Mints USDT and Liquidations Hit Crypto Markets, Bitcoin and ETF Outflows: How Crypto Reacts to Fund Selling, and Stablecoins, DeFi Hacks and Bitcoin: Reading the Crypto Risk Map.
What our analysts watch: Three reads convert the driver framework into a sized position rather than a directional bet. Federal Reserve dot-plot trajectory against market-implied rate path (when the FOMC dot-plot signals fewer rate cuts than the market has priced in, the discount-rate adjustment compresses Bitcoin multiples by roughly 3 to 6 percent within the next five trading sessions; the disciplined trader sizes positions around the dot-plot release rather than the headline rate decision).
Whale-cohort accumulation versus exchange inflow ratio (a steady accumulation pace by addresses dormant for more than 155 days during a sideways tape is the structural buy signal; rising exchange inflows from the same cohort during a rally is the structural distribution warning). ETF issuer-level flow concentration (IBIT setting the pace while peers normalise is the constructive read; concentrated outflows at one issuer with simultaneous inflows at peers signals tactical rotation rather than structural retreat).
The Bank of England monetary policy publishes the meeting schedule that anchors the macro-driver read, the CoinDesk on-chain coverage tracks the whale-positioning data, and the FATF virtual asset guidance documents the international policy framework that frames the cross-jurisdictional flow context. Volity offers spot Bitcoin and Ethereum CFD execution under CySEC oversight via UBK Markets (licence 186/12), with entities in Saint Lucia, Cyprus, and Hong Kong.
Frequently asked questions
Why does the dot-plot release matter more than the headline rate decision for Bitcoin?
Because the headline rate decision is typically priced into futures and equity markets in the days leading into the FOMC meeting, while the dot-plot reveals the forward path that institutional allocators apply to multi-quarter discount-rate models. The Bitcoin allocator base trades the multi-quarter horizon rather than the single-decision horizon, which means the dot-plot adjustment is the input that triggers the position-sizing recalibration. The disciplined trader sizes positions around the 2 p.m. statement and the 2:30 p.m. press conference rather than around the rate-decision moment, because the dot-plot is in the statement and the path commentary is in the press conference.
How should traders interpret the 155-day dormancy threshold for whale accumulation?
The 155-day threshold is the structural reference for distinguishing long-term holder behaviour from tactical positioning. Addresses that have held coins for more than 155 days have historically demonstrated cycle-length holding patience, which means accumulation by this cohort during a sideways tape is the highest-confidence regime signal the on-chain dataset produces. The disciplined response is to weight 155-day-plus accumulation heavily as a structural buy signal and to discount sub-155-day accumulation as tactical, because the buyer cohort with cycle-length patience is the only one that has historically held through the multi-quarter drawdowns that test the bull thesis.
What does ETF issuer concentration reveal that headline ETF flow does not?
It reveals whether the institutional bid is broad-based or concentrated, which is the diagnostic for whether the rally durability is supported by multiple allocator cohorts or by a single dominant cohort. A concentrated inflow at IBIT against softer flow at peers signals issuer differentiation rather than category-wide weakness, which is the constructive variant. A concentrated outflow at one issuer with simultaneous inflows at peers signals tactical rotation, which is also constructive at the category level. The bearish variant is correlated outflows across issuers, which signals category-wide retreat rather than tactical rotation; the headline ETF flow number alone cannot distinguish the three cases, which is why the issuer-level read is the disciplined input.
How do macro and on-chain drivers interact during stretched-volatility windows?
They interact through the position-sizing channel rather than through directional alignment. During stretched-volatility windows (FOMC weeks, major options expiries, geopolitical event windows), the on-chain drivers retain their structural signal value but the macro drivers temporarily dominate the price-discovery process. The disciplined response is to size positions to the lower of the two reads during the window and to re-engage the structural sizing once the macro window resolves. The pattern is that on-chain accumulation during a stretched-volatility window followed by macro-driven downside is historically the highest-quality entry the cycle produces, because the structural buyer is providing the bid that the macro-driven seller is absorbing.
Related guides
- Bitcoin explained
- Cryptocurrency trading
- Crypto trading platforms
- Best crypto investments
- Risk management
Volity operates a trading platform and also publishes educational and analytical content about trading. The content on this page is for educational purposes only and should not be considered financial advice. Volity may benefit commercially when readers open trading accounts through links on this site.
Our content is produced and reviewed under documented editorial standards; comparison and review methodology is published here.