Investing in financial products involves risk. Losses may exceed the value of your original investment.
Bmnr pton ethereum is a core topic for traders in 2026. The complete guide follows.
Hot trading setups: bmnr surges on crypto hoard, pton flirts with a breakout as volatility bites
By Volity Market Scout
March 30, 2026
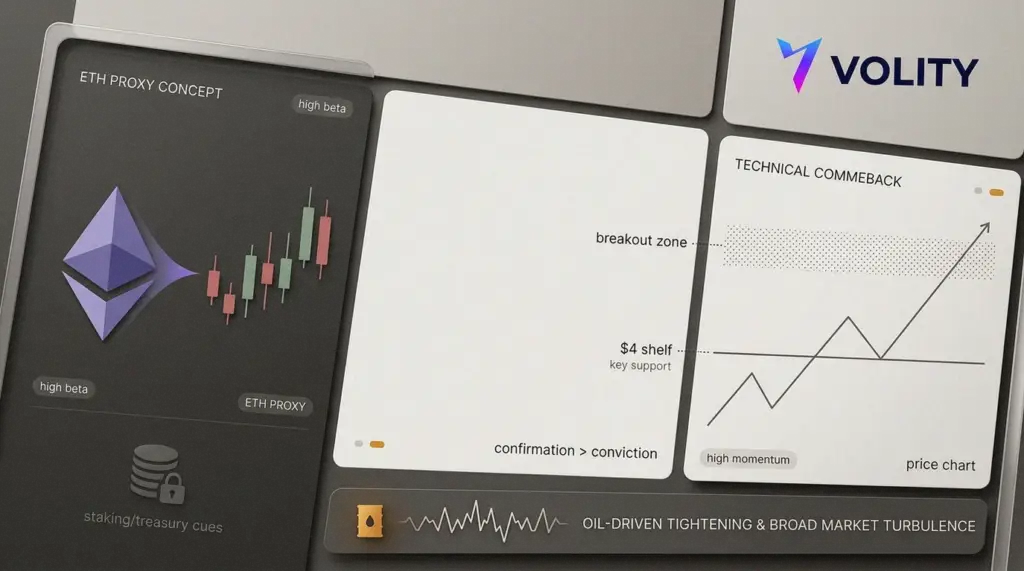
Two very different charts are doing the same job this morning. They are pulling risk-takers back into the ring. Bitmine Immersion Technologies (BMNR) has turned itself into a crypto proxy with a swaggering tape. Meanwhile, Peloton (PTON) has gone from left-for-dead to technically tight, even as sellers still lurk.
However, traders should treat both as event trades, not beliefs. BMNR’s story depends on Ethereum staying bid. PTON’s depends on momentum holding above a thin base. Therefore, position size matters more than the narrative.
Bmnr: a crypto balance sheet disguised as an equity
BMNR has been the loudest thing on many momentum screens. Shares touched $19.86 on March 29 and traded around $19.18 after ranging up from roughly $18.28. The tape feels like a crypto market, because the underlying economics now largely are.
The company has pointed investors to an Ethereum pile measured in millions. It cited 4.66 million ETH, valued near $11 billion as of March 22, using an ETH price of $2,072.
A week earlier, it talked about 4.596 million ETH, valued with ETH at $2,185. That is not a footnote.
It is the business model, at least for now.
Meanwhile, staking adds another lever. Staked ETH is said to top 3.14 million. Management also flagged the MAVAN staking launch in Q1 2026, highlighted again on March 26. Therefore, in a rising ETH tape, BMNR can behave like a high beta call option on crypto sentiment.
Still, the equity wrapper brings its own weirdness. The screen shows a market capitalisation near $8.38 billion, a negative P/E around -21, and a stated dividend yield near 5.4%. Those figures do not sit neatly together, which is exactly why this is a trader’s stock.
Pton: from 1-year low to momentum trap, or momentum start
PTON printed a bruising 1-year low at $3.81 on March 2 and closed near $3.905 that day on about 1.1 million shares. Since then, the stock has tried to rebuild its spine.
On March 27, it jumped about 8.85%, rising from roughly $4.01 to $4.43. It also tagged an intraday high near $4.745, which is the sort of move that forces shorts to look up from their spreadsheets.
Technicals have warmed quickly. A popular technical dashboard showed RSI(14) around 73.7 and CCI(14) near 178, with a clean set of “buy” readings across moving averages.
However, that heat can also be the problem. The stock reportedly broke above the upper Bollinger band on March 27, which can precede a snapback.
Meanwhile, a 9-day stochastic %K around 17.56 sits in oversold territory, which clashes with the hot RSI print and signals a messy, whippy tape.
Wall Street remains split. One compilation shows a “hold” consensus with an average target around $8.42, yet a very wide range from $4 to $20. Volatility is not theoretical either, with beta near 2.47. Adding to the tension, insiders reportedly sold about $5.14 million of stock over the past 90 days.
Therefore, the clean way to trade it is simple. If it holds above the $4 area, momentum traders can stalk a push into the mid-$5s. If it loses that shelf, the breakup rally becomes a bull trap.
Other catalysts in the mix
Elsewhere, the market is juggling micro setups against macro nerves. Oil at $150 would not just hurt consumers. It would squeeze margins, tighten financial conditions, and drag on risk-on trades. Meanwhile, traders still have earnings season aftershocks to play, especially in names where expectations look lazy.
- AMD remains an AI momentum favourite, but traders want fresh target checks before chasing old numbers.
- FSLR has stayed heavy after a steep drop and technical damage, while competition pressure remains a theme.
- PHR heads into Q4 earnings on March 30, with talk of EPS around $0.07 versus $0.18 prior.
- SNX draws yield screens with about $1.92 annual dividend, near 1.22%.
By the numbers
- BMNR high: $19.86 on March 29; last noted around $19.18
- BMNR ETH cited: 4.66m ETH valued near $11bn as of March 22 at $2,072
- BMNR staked ETH: above 3.14m
- PTON 1-year low: $3.81 on March 2; close about $3.905
- PTON March 27 move: about +8.85% to $4.43; high near $4.745
Key takeaways
- BMNR trades like ETH with equity hours, so treat it as a crypto beta position, not a normal balance sheet story.
- PTON’s breakout attempt is real, but stretched signals mean it can whip hard both ways.
- Risk plans should anchor on obvious levels: BMNR’s last breakout zone, and PTON’s $4 shelf.
- Insider selling in PTON raises the bar for follow-through, so demand confirmation before sizing up.
- Macro oil risk can swamp single-stock setups quickly, so keep stops mechanical and timeframes short.
For more on this topic see our deep-dives on Crypto Investment News: DeFi Governance Tokens and Meme Coin Breakouts, Singapore Gulf Bank x Fireblocks: Secure DeFi Banking and Payments, and Interactive Brokers USDC Deposits: Stablecoin Rails Meet Brokerage.
For more on this topic see our deep-dives on Dell AI Orders and Backlog: How Hardware Drives the AI Trade, Sector Rotation Explained: When Energy and Defensives Beat Mega-Tech, and Intel Stock and Defensive Rotation: How Investors Position Pre-Earnings.
Alexander Bennett notes: Three frames separate disciplined position management from the momentum-chase distribution on both names. ETH treasury beta calibration on BMNR (the position behaves as a high-beta long-ETH expression with embedded operational risk from the staking infrastructure layer; the disciplined practice is to size the position against an ETH price decline scenario rather than against an equity price decline scenario, because the equity-level decline is bounded below by the on-chain reserve value while the upside scales with ETH price action).
Multi-indicator divergence on PTON (RSI(14) at 73.7 on the upper bound while the 9-day stochastic %K sits in oversold territory near 17.56 produces a whippy multi-timeframe signal that punishes single-timeframe positioning; the disciplined response is to wait for the indicators to align across timeframes before entering, rather than to bet on the higher-timeframe RSI continuation). Insider-flow trajectory on PTON (5.14 million dollars of insider sales over 90 days is a meaningful informational input; the structurally honest framing acknowledges that insider distribution typically precedes the breakout-failure variant rather than the breakout-continuation variant, which compresses the conviction on the long position).
When the three frames align, the trade carries weight beyond the chart shape. When they diverge, the entry defers.
Frequently asked questions
Why does BMNR behave like an ETH-beta proxy rather than a conventional operating equity?
Because the disclosed ETH holdings (4.66 million ETH) at the disclosed reference price translate to roughly 11 billion dollars of underlying token value against an equity market value near 8.38 billion dollars, which means the on-chain reserve exceeds the equity capitalisation; the operating-business cash flow is structurally secondary to the token-value mark in the equity valuation. The structural consequence is that the equity tracks ETH price action with high correlation during normal market windows and decouples only during operational-stress windows specific to the staking infrastructure layer or the corporate governance layer. The disciplined position-sizing approach treats the position as a long-ETH expression with embedded operational risk from the corporate wrapper, rather than as a conventional momentum equity. The CoinDesk ETH treasury reporting coverage documents the wider category trajectory.
What does the negative PE and 5.4 percent dividend yield combination signal on BMNR?
The combination signals that the equity reflects two valuation regimes simultaneously: the operating-business loss profile (negative PE near minus 21) and the staking-yield-derived distribution capacity (the 5.4 percent dividend yield reflects the staking-rewards stream rather than operating-cash-flow distribution). The structural consequence is that conventional valuation metrics produce inconsistent reads because they apply mismatched analytical frames to the hybrid wrapper; the structurally honest framing acknowledges that the equity is best evaluated through token-value and staking-yield metrics rather than through traditional operating-business multiples. The disciplined practice tracks the on-chain reserve trajectory and the staking-reward distribution rate as the primary valuation inputs, with the operating-business metrics as informational rather than analytical inputs. The SEC corporate disclosure framework documents the disclosure backdrop for the hybrid-wrapper category.
How should traders interpret the multi-indicator divergence on PTON?
The right interpretation reads the divergence as a regime-uncertainty signal rather than a directional setup. RSI(14) at 73.7 on the daily reflects the post-rally overbought condition that historically precedes mean-reversion windows; the 9-day stochastic %K at 17.56 reflects the shorter-timeframe oversold condition inside the broader rally.
The two indicators produce a whippy intraday tape that punishes single-timeframe positioning because the directional signal flips with the timeframe selection. The disciplined response is to wait for the indicators to align across timeframes (RSI compresses below 70 while stochastic %K rises above 50, signalling a coordinated upward continuation; or RSI compresses below 70 while stochastic %K stays below 30, signalling a coordinated downward resolution) before entering, rather than to bet on the higher-timeframe RSI continuation in isolation.
The Investopedia reference on RSI and momentum indicators covers the analytical framework.
Should retail traders treat the PTON 4 dollar level as the conviction line for the breakout trade?
The 4 dollar level functions as the structural-support reference because it sits above the 3.81 dollar one-year low and below the 4.43 dollar post-rally close, which makes a clean hold above 4 dollars the configuration that supports the momentum-continuation variant. The disciplined frame sizes the position for the path-dependent distribution rather than for the directional resolution, with a defined risk-reward setup at the 4 dollar invalidation level and the mid-5 dollar continuation target. The structurally honest framing acknowledges that the 5.14 million dollars of insider distribution over the trailing 90 days compresses the conviction on the multi-week continuation thesis, which means the right expression is a tactical trade with tight position sizing rather than a structural position with extended duration. Defined-risk option structures with shorter expiry handle the path-dependent setup better than spot positioning sized to a wider stop band, particularly given the beta near 2.47 that amplifies the path-execution risk on the spot leg.
Related guides
- Ethereum explained
- Stocks investing for beginners
- Swing trading platforms
- Day trading platforms
- Best trading platforms
Volity operates a trading platform and also publishes educational and analytical content about trading. The content on this page is for educational purposes only and should not be considered financial advice. Volity may benefit commercially when readers open trading accounts through links on this site.
Our content is produced and reviewed under documented editorial standards; comparison and review methodology is published here.