Investing in financial products involves risk. Losses may exceed the value of your original investment.
Bitcoin price breakout is a core topic for traders in 2026. The complete guide follows.
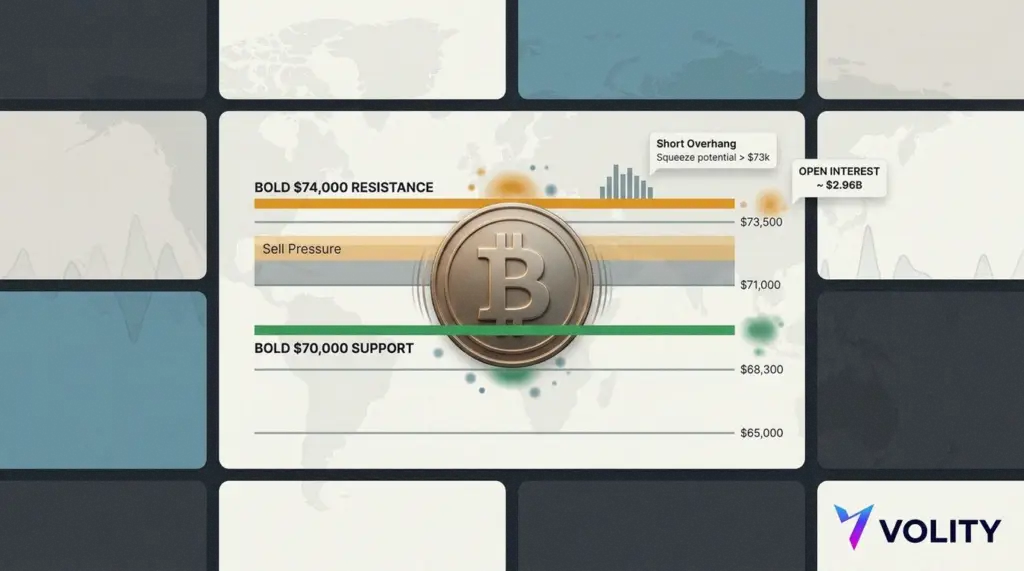
Bitcoin spent mid-March 2026 doing what it does best at awkward moments, moving sideways and making everyone else sweat. BTC hovered between about $70,000 and $73,500, after failing again near $74,000 earlier this month. Therefore, the market has turned that round number into the sort of line traders draw in permanent marker.
Price action looks like a coiled spring, yet it also looks like a tired rally. However, both readings can be true in a market that runs on positioning as much as conviction. Bulls point to Bitcoin’s ability to hold well above $65,000 despite sour macro tape. Bears point to repeated rejection near $71,000 to $74,000 and the slow grind of lower highs.
That $74,000 area now acts as the gate. If Bitcoin clears it with volume and follow-through, the current range becomes a launchpad.
Meanwhile, if BTC slips under $70,000 and can’t claw back quickly, attention shifts to $68,300, then $65,000. Those levels are not mystical.
They are where bids have appeared, where stop-losses cluster, and where narratives flip.
Geopolitics has added grit to the gears. Escalating U.S.-Iran tension has kept larger pools of capital cautious, even as crypto natives remain eager to buy dips.
Consequently, each pop into the low $70,000s has met sellers who want less exposure into the next headline. The market is not pricing a single outcome.
It is pricing discomfort.
Derivatives explain the day-to-day tug of war. Open interest sits around $2.96 billion on major venues, with heavy positioning between $69,000 and $71,000.
In addition, an estimated $180 million to $220 million of shorts sit around current levels. That matters because a push through $73,000 could force buy-to-cover orders, then trigger liquidations, then feed momentum.
Traders have seen that film before, and it rarely ends quietly.
Order books, however, show the other side. Sell interest thickens between $71,000 and $74,000, which explains the repeated stalls. Therefore, spot demand must not only show up, it must persist. A single spike will not do the job if large holders use strength to offload.
Technicians have split into two camps that barely share a chart. One camp calls this “digestion” ahead of a run at $80,000, with measured-move targets floated in the $85,000 to $90,000 zone if new highs stick. The other camp reads a failed breakout and expects a retest of $68,000 to $69,000, with $65,000 next if that shelf cracks. Meanwhile, the market itself has chosen the least satisfying path, long enough to lure both sides into overconfidence.
The $73,000 level sits at the centre of the argument. It is a technical confluence point, tied to extension levels from the October 2025 low through the December 2025 high, and it also aligns with supply built during the November to December accumulation phase. As that supply meets fresh buying, the first test tends to produce selling. Therefore, bulls need a second and third attempt that keep gaining ground, not fading.
Still, the quieter story runs underneath the candles. ETF flows and corporate treasury nibbling have provided a firmer base than many expected during a tense macro backdrop. However, institutional demand has not been loud enough to overwhelm the sellers near resistance. That is why this range feels less like boredom and more like negotiation.
By the numbers
- Range: roughly $70,000 to $73,500 in mid-March 2026
- Key resistance: $74,000, with friction from $71,000 to $74,000
- Key supports: $68,300, then $65,000
- Derivatives: open interest near $2.96 billion
- Short overhang: about $180 million to $220 million around current levels
Key takeaways
- If BTC reclaims $73,000 and holds, shorts may fuel a fast squeeze toward $76,000 to $78,000.
- Repeated failure below $71,000 keeps the $74,000 ceiling credible and encourages sell-the-rip behaviour.
- A clean break under $70,000 shifts focus to $68,300, where buyers must defend to avoid a slide to $65,000.
- Geopolitical headlines remain the wildcard, since they can flip risk appetite in minutes.
For now, Bitcoin is not “undecided”. It is priced like a market waiting for permission. Either $74,000 breaks and the range becomes history, or support gives way and the next trade starts lower.
For more on this topic see our deep-dives on Bitcoin Price Drivers: Fed Decisions, Whale Moves and ETF Flows, Bitcoin Price at a Crossroads: Crypto Tax Deadline Explained, and Bitcoin, Coinbase Listings and Hack Jitters: Reading Crypto Market Risk.
What our analysts watch: Three reads turn the breakout-versus-breakdown decision into a sized position rather than a directional bet. Volume and follow-through quality on the 73,000 dollar attempt (a single-spike rejection at the level signals that large holders are using strength to offload supply rather than confirming the breakout; bulls need a second and third attempt that gain ground rather than fade, which is the diagnostic that distinguishes a real breakout from a stop-running probe).
Order-book depth between 71,000 and 74,000 dollars (the resistance thickness in this band is what produces the repeated stalls; spot demand must not only show up, it must persist past the cumulative offer that historically clears at 1 to 1.5 billion dollars of resting sell interest). ETF and corporate treasury bid quality at the lower band (the firmer base near 65,000 dollars during a tense macro tape signals that the structural bid is intact even when secondary-market enthusiasm fades; a deeper test that holds 65,000 dollars without broad ETF outflows is the highest-quality buy signal the range produces).
The StockCharts ChartSchool reference on support and resistance covers the cross-asset framework, the CoinDesk derivatives coverage tracks the open-interest cycle, and the Bank of England monetary policy publishes the FOMC calendar that frames the macro tape risk. Volity offers spot Bitcoin and futures-style crypto exposure under CySEC oversight via UBK Markets (licence 186/12), with entities in Saint Lucia, Cyprus, and Hong Kong.
Frequently asked questions
Why does the 73,000 dollar level carry weight beyond the 74,000 dollar headline?
Because 73,000 dollars sits at the technical confluence of multiple structural references (the extension level from the October 2025 low through the December 2025 high, plus the November to December accumulation supply zone), which makes it the operational gate for the breakout thesis even though 74,000 dollars is the headline resistance. The trade behaviour at 73,000 dollars is more diagnostic than at 74,000 dollars: a tight intraday rejection with closing strength signals that the breakout is being absorbed, while a clean close above 73,000 dollars on volume opens the path toward the 74,000 dollar headline and beyond. Treating 74,000 dollars as the only relevant level misses the operational signal that the 73,000 dollar test produces.
How should the 180 to 220 million dollar short overhang inform position sizing?
The overhang functions as a fuel reservoir for upside continuation rather than as a directional signal in itself. Once the 73,000 dollar gate clears, the short positioning is forced to cover, which produces a buy-to-cover cascade that historically extends 4 to 7 percent past the initial trigger before the short cohort exits. The position-sizing implication is that long entries near the gate should size for the path-dependent extension rather than the linear move; the typical disciplined sizing applies a target zone of 76,000 to 78,000 dollars rather than a single point estimate.
What is the read if Bitcoin slips below 70,000 dollars without a quick reclaim?
The read is that the structural bid that defended the range has paused rather than disappeared, with the next test sitting at 68,300 dollars and the structural reference at 65,000 dollars. The disciplined response is to scale long exposure into the test rather than chase the breakdown short, because the historical pattern is that Bitcoin breakdowns from sub-71,000 dollar pivots typically resolve through 5 to 8 percent overshoots before the structural bid re-engages. Defensive shorts during the test require a specific edge in either dealer-flow modelling or macro timing; for accounts without that edge, the position management is the trade rather than directional positioning.
Does the geopolitical tape add weight to the breakout or breakdown thesis?
It adds asymmetric weight to the breakdown thesis through the macro-pricing channel, but the structural ETF bid offsets the weight at the lower band. The U.S.-Iran tension premium that has held larger pools of capital cautious is the specific reason intraday rallies into the low 70,000 dollar range have met sellers; the structural ETF flow is the specific reason the 65,000 dollar shelf has held. The clean read is that the geopolitical premium suppresses the breakout probability and supports the lower band; both effects are mid-magnitude rather than dominant, which keeps the path-dependent range thesis intact.
Related guides
- Bitcoin explained
- Cryptocurrency trading
- Crypto trading platforms
- Risk management in trading
- Risk-reward ratio
Volity operates a trading platform and also publishes educational and analytical content about trading. The content on this page is for educational purposes only and should not be considered financial advice. Volity may benefit commercially when readers open trading accounts through links on this site.
Our content is produced and reviewed under documented editorial standards; comparison and review methodology is published here.