Investing in financial products involves risk. Losses may exceed the value of your original investment.
Crypto investment trends is a core topic for traders in 2026. The complete guide follows.
Crypto’s November crossroads: bulls, bears, and the sideline billions
The curtain rises on mid-November, and the global crypto stage is humming with high-stakes drama: price swings, “whale” maneuvers, ETF outflows, and looming regulatory pivots. For traders and long-term players alike, recent months offers a lesson in watching the horizon while bracing for every swell.Bitcoin: still the axis, now with more drama
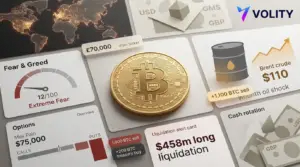
No digital asset draws as many spotlights, or as much capital, as Bitcoin. After punching past $115,000 in late summer, Bitcoin spent early November wrestling with cautious sentiment and stalling between $107,000 and $110,000. The culprit? October’s “Red October” snap-a rare 3.6% single-month loss for BTC, snapping a five-year run of October green. Anxieties over US ETF outflows (about $191 million in early November), a negative Coinbase premium, and hawkish global central banks pulled major coins-BTC, ETH, SOL, and more-sharply downward.Yet, history provides a different perspective. November has averaged over 40% gains for Bitcoin since 2013, and analysts still float predictions of $150,000, even $180,000 or $250,000, by the close of 2025-if macro winds turn favourable and “Santa Rally” euphoria returns in December.Ethereum, altcoins, and the “utility pivot”
Ethereum didn’t escape the autumnal downpour, dropping below $4,000 and later clinging to the $3,700-$3,800 band. Almost 10% of its market cap vanished in the November correction, as over-leveraged bets got flushed out. Still, technical analysts see room for a rebound if long-term investor confidence endures, especially with Ethereum’s looming upgrades and expansion into real-world asset tokenisation. Tech-centric tokens-think Solana, Chainlink, Zcash-have drawn institutional money, shifting attention to projects with tangible use cases instead of meme-driven volatility.Altcoins overall mirror Bitcoin’s tone-risky, technically “oversold”, but not abandoned. Meme coins have faded; the serious money, for now, chases projects whose blockchains do something useful.Big whales, bigger moves
One October-November headline: whales are back. Large investors orchestrated multi-million dollar moves across BTC, ETH, and select altcoins, indicating renewed accumulation and positioning for a potential macro shift.- t
- High-profile Bitcoin wallet reshuffling-a signal that “smart money” may expect an end to this corrective pattern and the birth of a winter rally. t
- Stablecoin inflows on major exchanges are climbing, suggesting capital is on the sidelines, waiting for conviction to redeploy.
DeFi and NFTs: resilience and rebalancing
The cascade didn’t spare the DeFi and NFT corners. November’s drawdown eroded Total Value Locked (TVL) in DeFi protocols as leveraged players got liquidated and cautious ones pulled liquidity. Sui, a prominent DeFi chain, saw DEX volume halve since October. NFTs witnessed slipping trading volumes and thinning floor prices, though standout collections rebounded by 10% within days as speculators hunted bargains.Institutions, regulation, and macro “X-factors”
Behind the scenes, institutions remain engaged. A recent surge in stablecoin balances and ongoing flows into index-aligned altcoin ETFs (notably Solana and XRP) stand in contrast to outflows from BTC ETFs-a sign of portfolio rebalancing, not retreat.The regulatory climate will set the next narrative. The EU’s MiCA rules and US SEC decisions due by April 2026 may “de-risk” the whole space, inviting even more institutional allocation. Tokenisation of real-world assets is on the threshold of mainstream use, and by 2026, stablecoins are expected to be as common-and as liquid-as fiat.Macro wildcards:
- t
- Federal Reserve statements in November: any dovish shift could trigger a market bounce. t
- US-China relations: headlines here move global liquidity and risk appetite. t
- Bitcoin dominance levels: a rise above 55% may spell further pain for altcoins before relief flows in.
Key strategies for the weeks ahead
- t
- Don’t bet on a crash-yet. Technicals point to a cooldown, not capitulation. Market liquidity is pausing more than fleeing. t
- Diversify and watch utility: Long-term, institutions are rewarding tokens that solve problems, tokenize assets, or enable next-gen DeFi/NFT experiences. t
- Keep an eye on the Fed, not just the charts: Macro announcements and rate pivots can instantly alter risk sentiment. t
- Look for stablecoin inflows: If stablecoins are moving onto exchanges, whales and funds are preparing to buy the dip. t
- Monitor ETF flows: Outflows from BTC ETFs don’t always mean panic; sometimes, it’s a sector rotation toward other crypto opportunities (like ETH, SOL, or institutional-grade altcoins).
The bottom line
recent months stands as a month of testing-of nerves, strategies, and the sector’s ability to mature through turmoil. The market is searching for its next conviction play: perhaps it’s a technical recovery into December, or perhaps the “Santa Rally” needs a fresh fuel source. Either way, seasoned traders are watching for that precise moment when caution turns to opportunity. Stay nimble. Watch the whales, trust the macro, and don’t forget: in crypto, volatility writes tomorrow’s headlines.For more on this topic see our deep-dives on BTC, ETH and XRP Outlook: Reading the Big-Three Crypto Signals, Crypto Market at $4T: Dogecoin ETF, Bitcoin Targets and Allocation, and Crypto Market Turmoil and the XRP ETF: Investment Insights.
For more on this topic see our deep-dives on Bitcoin Options Expiry and Crypto Volatility: Trader Playbook, Ferrari Crypto Token: 499P Auction and Luxury Tokenization Trend, and Korean Fintech Merger Shakes Crypto Market as Solana ETFs See Outflows.
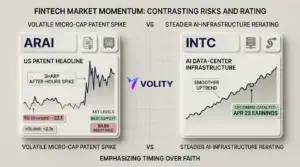
What our analysts watch: Three lenses dominate our reading of the equity tape. Sector rotation tells us where capital is moving (defensives versus cyclicals, value versus growth). Earnings revisions show whether analyst expectations are catching up to or trailing reality. Real yields and the dollar set the discount rate that valuation multiples respond to. When earnings estimates rise faster than the index price and real yields stabilise, the setup tends to favour patient longs.
Frequently asked questions
How much money do I need to start trading stocks?
Many regulated brokers now allow account opening with no minimum deposit and offer fractional shares for as little as $1. A practical starting balance for a long-only beginner is $500 to $2,000, enough to diversify across a handful of positions without paying meaningful percentage spreads. The FCA publishes investor education resources worth reading before opening an account.
What is the difference between stocks, ETFs, and CFDs?
A stock is direct ownership in a company. An ETF is a basket of stocks (or other assets) traded as a single security. A CFD (contract for difference) is a leveraged derivative that tracks the underlying price without conferring ownership. Each has different cost, tax, and risk profiles. ESMA imposes leverage caps on retail CFDs in the EU and UK.
How do I choose a trustworthy broker?
Verify regulation with a tier-one authority (FCA in the UK, CySEC in Cyprus, BaFin in Germany, ASIC in Australia, or your local regulator). Check segregated client funds, negative-balance protection, transparent fees, and a clean disciplinary record. Avoid any platform offering guaranteed returns or pressuring deposits. The FCA Financial Services Register is free to search.
Should I day-trade or invest long-term?
Most retail accounts that day-trade lose money over time. Long-term passive investing in diversified index ETFs has historically delivered competitive returns with far less effort and lower stress. Active day-trading can work, but it requires capital, an edge proven over hundreds of trades, and the time to monitor positions intraday. Start passive; layer active only after the basics are durable.
Related guides
- Bitcoin explained
- Ethereum explained
- Cryptocurrency trading
- Best crypto investments
- Crypto trading platforms
Alexander Bennett, Volity research: The Volity desk tracks three indicators on every weekly update: net ETF flows for BTC and ETH, the BTC dominance ratio against the broader altcoin complex, and the aggregate stablecoin market cap. When ETF flows are positive, BTC dominance is falling, and stablecoin caps are rising, the setup favours an altcoin rotation. When all three reverse, defensive positioning compounds. Treating any one indicator as standalone produces false signals across the cycle.
Volity analyst FAQ
Are spot Bitcoin ETF flows a reliable trend signal?
ETF flows are useful directional signals because they aggregate institutional allocation decisions that move slower and stickier than retail flow. Sustained positive flows indicate sticky demand; sharp reversals indicate tactical de-risking. The signal is most reliable when measured over multi-week windows rather than single-day prints. The CoinDesk Bitcoin price reference contextualises flow data against price action.
What does sideline capital in stablecoins actually mean?
The aggregate stablecoin market cap measures the dollar-equivalent value parked in dollar-pegged tokens, which can rotate into other crypto assets quickly. Rising stablecoin caps during a price drawdown indicate dry powder accumulating off-chain in onramps; falling stablecoin caps during an uptrend indicate that sideline capital is rotating in. Both patterns inform timing more than direction. The BIS research on stablecoins covers the structural context.
How does altcoin rotation work after a BTC rally?
The historical pattern runs in three stages: Bitcoin breaks out and consolidates, capital rotates into Ethereum on the relative-value trade, then into majors like Solana and XRP, and finally into the long tail of mid-cap and small-cap altcoins. The compression of the cycle varies, but the order is consistent. Allocators time entries by stage, not by single-asset conviction. The Investopedia altcoin primer covers the structural backdrop.
Should I follow ETF flows or on-chain data?
Both, with different time horizons. ETF flows describe institutional positioning at a daily and weekly cadence and inform multi-week tactical decisions. On-chain data describes wallet behaviour at higher resolution but with more noise. Sophisticated allocators triangulate the two: when ETF flows confirm what on-chain whales are doing, conviction rises. When they diverge, the divergence itself is the signal worth investigating.
External references
- CoinDesk Bitcoin price
- BIS research on stablecoins
- Investopedia altcoin primer
Volity operates a trading platform and also publishes educational and analytical content about trading. The content on this page is for educational purposes only and should not be considered financial advice. Volity may benefit commercially when readers open trading accounts through links on this site.
Our content is produced and reviewed under documented editorial standards; comparison and review methodology is published here.