Investing in financial products involves risk. Losses may exceed the value of your original investment.
Sector rotation trades is a core topic for traders in 2026. The complete guide follows.
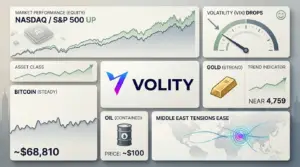
Market rotation heats up as tech stumbles and energy surges
By Volity Market Scout
April 10, 2026
Traders have started to talk like it is 2022 again. However, this time the selling sits inside the winners. The Nasdaq has now logged five straight weekly declines. Meanwhile, money has crept into areas many desks ignored for months.
The so called Magnificent 7 still dominates index weightings. Yet leadership has frayed, day by day, across megacap software and semis. Short interest has risen in chips to about 0.285% and in software to about 0.826%. Therefore, even small downdrafts can feel heavier than they look on a chart.
This is not a broad panic, at least not yet. Instead, it reads like a rotation with sharp elbows.
Tech is down about 1.97% over three months. That follows a 21.43% tear.
Consequently, parts of the sector now look less invincible and, in places, oddly reasonable.
Energy has been the loud counterpoint. Oil is up roughly 12% year to date, helped by fresh geopolitical nerves. Tensions around Hormuz have put a risk premium back into barrels. As a result, the gap between energy strength and tech weakness has widened to roughly 25 points, even after a minor tech bounce.
Momentum traders have noticed the strain. Oversold screens are lighting up across large, liquid names. As of April 2, RSI readings sat below 30 for AMGN (28), CMCSA (28), MCD (24), NKE (22), PG (27), PM (21) and TMUS (25). Meanwhile, parts of energy are starting to look crowded, with COP around an RSI of 70.
That push and pull matters because rotations rarely travel in straight lines. When energy runs hot, it often pauses, then resumes if crude holds. When tech sells hard, it often snaps back, then either stabilises or rolls again. Therefore, the best trades right now lean on relative strength and mean reversion, not heroic forecasting.
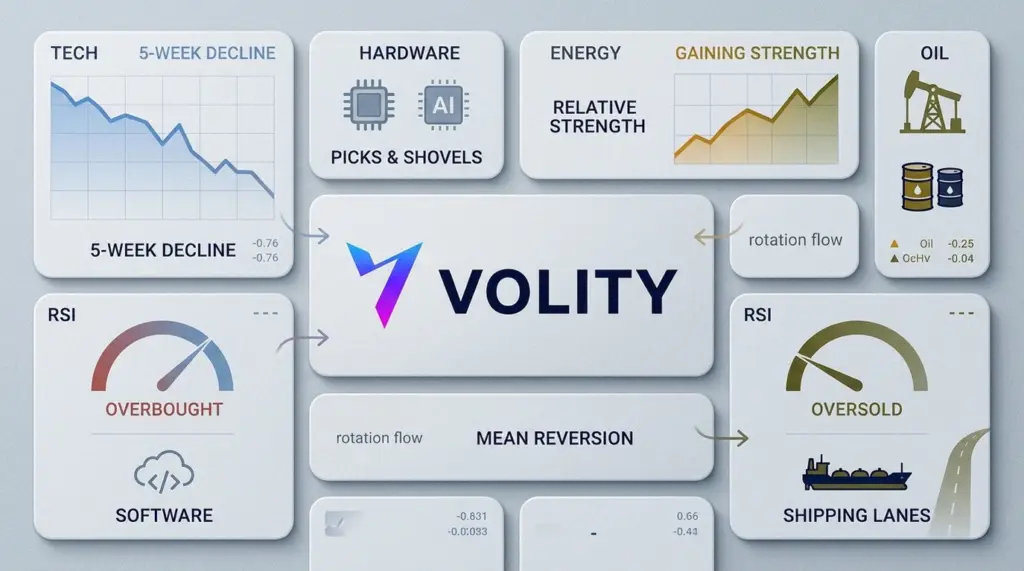
Hardware beats software, even inside tech
One of the cleaner tells has been inside the sector itself. Hardware is holding up better than software. MRVL has gained about 6.73% while the Nasdaq has fallen about 4.76% over the same window cited by Volity. Meanwhile, INTC has become a proxy for the “rebuild and retool” side of chips, not the glamour side.
That split fits the current tone. Traders still want AI exposure. However, they prefer picks and shovels, including data centre plumbing. Therefore, the “buy hardware, sell software” pair trade has gained fans again.
Energy trades feel obvious, which is the risk
With oil flirting with $100 talk, the trade has become simple. Long XOM, CVX and COP, and let geopolitics do the work. Yet crowded trades punish sloppy entries. Consequently, RSI and volume matter more than narratives this week.
If COP stays overbought, a pullback can happen fast, even if crude remains firm. Meanwhile, a dip that holds prior breakout levels often invites systematic bids again. Therefore, energy bulls may want to size smaller and add on confirmation, not headlines.
Healthcare and idiosyncratic catalysts
Healthcare has offered a different type of shelter. UNH remains a defensive favourite tied to Medicare themes. Meanwhile, TLX has swung on regulatory momentum after FDA-related news flow. As a result, single name catalyst trades can work even as index leadership shifts.
Overbought fades, oversold snaps
Rotation markets reward discipline. Names like IRDM (RSI near 77) and TRIP (near 70) fit the classic “too far, too fast” bucket. Meanwhile, the oversold list in staples, telecoms and healthcare suggests short term snap backs of 2% to 5% can appear without warning.
Still, oversold does not mean “can’t fall”. It only means selling has been intense. Therefore, traders should demand a trigger, such as RSI crossing back above 30, or a reversal day on heavy volume.
By the numbers
- Nasdaq: five straight weekly declines
- Short interest: semis about 0.285%, software about 0.826%
- Oil: up about 12% year to date
- Oversold RSI: NKE 22, PM 21, MCD 24, TMUS 25
- Overbought RSI: COP about 70
Key takeaways
- Trade the spread: consider long hardware versus short software, using MRVL and selected software baskets.
- Respect crowded energy: use pullbacks and volume confirmation, especially with COP looking stretched.
- Hunt snap backs: oversold large caps can bounce sharply, but wait for reversal signals.
- Keep stops tight: rotations whip, so risk control matters more than being “right”.
- Watch crude and rates: both can flip the rotation in a single session.
The mood shift is plain on any sector heat map. Tech is no longer a one way bet. Meanwhile, energy has become the obvious hedge, which is exactly why it may bite late arrivals. Therefore, the next few sessions may reward traders who stay light, react quickly, and treat every chart like it can change its mind.
For more on this topic see our deep-dives on NVIDIA Blackwell GPU: Architecture, Specs, AI and Gaming Impact, Hang Seng Tech and China AI: Trading Alibaba and HK Tech Catalysts, and AI Stocks Rally as Oil Surges: Where Traders Are Looking Now.
What our analysts watch: The Volity desk runs any rotation read through three filters. The XLK versus XLE rolling 30-day relative strength (the headline rotation indicator).
RSI extremes across constituents (oversold large caps in staples and telecom often snap back two to five percent without warning, while overbought energy names like COP can pull back fast). Crude curve plus 5-year breakeven inflation together set the macro backdrop that decides whether the rotation extends or reverses.
When all three rotate the same way, sizing into the spread trade is asymmetric. When they diverge, the patient trade is to wait.
Frequently asked questions
How long does a typical tech-to-energy rotation last?
Historical rotations have ranged from three weeks to four months. The shorter ones reverse on macro repricings (rate-cut expectations, dollar reversals). The longer ones tend to coincide with sustained commodity supply premia or structural earnings revisions. The Investopedia sector rotation reference walks through the historical patterns.
Why does hardware sometimes outperform software inside tech?
Hardware revenue tracks immediate enterprise capex; software revenue depends more on subscription expansion and renewal cycles, which decelerate later in the rotation. The hardware-versus-software pair trade often works during the early part of a tech derating because the cyclical pass-through differs across the sector. The BIS publishes research on sector-level capex transmission.
How reliable is RSI for catching oversold rebounds?
RSI below 30 on liquid large caps is a high-probability setup for a two to five percent snap-back rally, but it does not predict trend reversal. The discipline is to demand a trigger (RSI crossing back above 30, a reversal day on heavy volume) before entering, then size for a swing trade rather than a position trade. The Investopedia RSI reference covers identification and probability research.
What kills a tech-to-energy rotation fast?
A clean reversal in crude (typically a Hormuz de-escalation or surprise OPEC supply increase) combined with falling real yields, which together favour growth multiples over cyclical earnings power. When both move the same direction in a single week, the rotation usually reverses by month-end. The US Energy Information Administration publishes the supply data that drives the crude reversal signal.
Related guides
- Stocks investing for beginners
- Indices trading platforms
- Best forex trading strategies
- Swing trading platforms
- Best trading platforms
Volity operates a trading platform and also publishes educational and analytical content about trading. The content on this page is for educational purposes only and should not be considered financial advice. Volity may benefit commercially when readers open trading accounts through links on this site.
Our content is produced and reviewed under documented editorial standards; comparison and review methodology is published here.