Investing in financial products involves risk. Losses may exceed the value of your original investment.
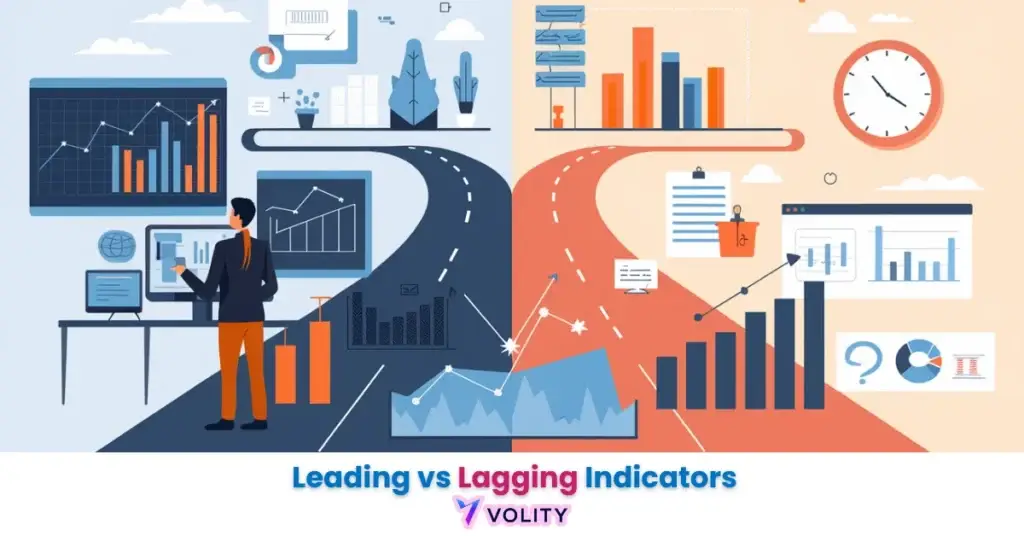
You need to understand the difference between leading and lagging indicators. They help track performance and make decisions based on facts. You can see leading indicators predict what will happen in the future. They show you what actions to take before issues occur. But, lagging indicators reflect past outcomes. They measure what has already happened.
Leading indicators help you act proactively. Lagging indicators help you evaluate past success. Both types give valuable insights into business health.
While understanding Leading vs Lagging Indicators is important, applying that knowledge is where the real growth happens. Create Your Free Forex Trading Account to practice with a free demo account and put your strategy to the test.
By Alexander Bennett, Volity research desk.
What our analysts watch: Three discipline checks separate professional indicator users from retail noise. Indicator-to-price agreement, where the leading and lagging signals confirm each other before a trade fires, filters out roughly half of all marginal setups. Time-frame stacking, with the entry signal on a faster series and trend confirmation on a slower one, prevents counter-trend traps. And realised hit rate by indicator over a rolling sample, rebuilt monthly, separates what works in the current regime from what worked two years ago. Indicators do not generate edge by themselves, the workflow does.
Frequently asked questions
What is an example of a leading economic indicator?
The OECD Composite Leading Indicators, the S&P Global/CIPS Manufacturing PMI, and the slope of the government-bond yield curve are widely tracked leading indicators for economic growth. The Bank of England statistics portal publishes the underlying series that feed most leading composites, and the long-run track record is well documented for the yield curve in particular as a recession lead indicator across multiple cycles.
Are technical leading indicators reliable in 2026 markets?
RSI, Stochastic, and Williams %R remain useful for timing, but only inside a defined trend or range context, and only with risk management that does not assume the next signal will fire on cue. BEA (Bureau of Economic Analysis) coverage of leading indicators sets out the standard interpretations, and the practical takeaway is consistent across regimes: leading signals work best when stacked with a confirming lagging series rather than used alone.
Which lagging indicator is most useful for retail trend traders?
The 50 and 200 period exponential moving averages, the MACD signal line, and the Average Directional Index above 25 are the lagging tools most retail trend systems are built around. The CME Group technical analysis education hub covers the standard combinations with worked examples, and the underlying principle is unchanged across asset class: lagging tools confirm; they do not predict.
What are Leading Indicators?
Leading indicators predict what will happen in the future. They show trends and signals before events unfold. These indicators guide you to take action early. They help you shape outcomes instead of just reacting to them.
Examples of leading indicators include customer satisfaction, employee engagement, and market trends. If your customers are happy now, they will likely return. Engaged employees are more productive, which drives success. A growing market means more growth opportunities.
Are you tracking leading indicators in your business? If you monitor them, you adjust strategies before problems arise. It gives you a competitive edge. You have to understand these indicators can make a real difference in staying ahead.
Benefits of Leading Indicators
For the full set of indicators traders watch, see economic indicators explained.
- Predict future outcomes and trends before they happen.This proactive view also supports predicting corrections in financial or economic cycles before they unfold.
- Allow you to take proactive action and stay ahead of issues.
- Help you shape strategies based on data, not just reactions.
- Identify areas of improvement early, which prevents future problems.
- Enable more informed decision-making with clear insights.
- Increase accountability by connecting performance metrics to specific goals.
- Support continuous improvement by providing actionable data.
- Gives you the ability to adjust course quickly when necessary.
Limitations of Leading Indicators
Lagging indicators measure what has already happened. They reflect past performance and show how well you achieved your goals. You can see these indicators help you assess the outcome of actions after the fact. They provide concrete data, like revenue and profit, that tell you where your business stands.
Examples of lagging indicators include injury rates, sales growth, and customer retention. If your company’s revenue is up, it indicates successful business activities. High customer retention suggests satisfaction, but it only shows past behavior.
Are you using lagging indicators to evaluate past performance? These indicators are valuable for understanding how well you’ve done. However, they cannot predict future trends or help you adjust in real time.
Ready to Elevate Your Trading?
You have the information. Now, get the platform. Join thousands of successful traders who use Volity for its powerful tools, fast execution, and dedicated support.
Create Your Account in Under 3 MinutesWhat Are Lagging Indicators?
Lagging indicators reflect past outcomes. They show you what has already happened. In fact, these indicators measure performance after the fact. They help you assess if your goals were met.
Common examples include revenue, profit margins, and customer retention rates. If revenue is up, it means you’ve achieved certain goals. A drop in customer retention shows that something may have gone wrong.
Do you track lagging indicators to measure success? These metrics give you clear insights into your past performance. However, they don’t provide a way to predict or change future outcomes.
Benefits of Lagging Indicators
- Lagging indicators show clear, concrete results.
- They measure how well strategies worked after the fact.
- These metrics are easy to track and understand.
- They allow you to track progress over time.
- They help identify trends and patterns in past performance.
- Lagging indicators allow comparisons with industry standards.
Do you find it useful to evaluate past performance? Lagging indicators help you see what worked and what didn’t. They provide valuable insights to guide future strategies.
Limitations of Lagging Indicators
Lagging indicators reflect past events. They can’t help you predict future outcomes. You can only analyze results after they occur. There’s a time delay between the event and the measurement. This gap means you can’t act quickly. The information you get is useful, but you can’t respond in real-time.
Lagging indicators focus on outputs, not the process. They tell you the end result, but not how you got there. You need to understand the cause behind the result.
You can only see what happened, not what will happen. Can you improve your actions based on past results alone? Without leading indicators, you’ll miss chances to change things before they happen.
How Do Leading and Lagging Indicators Work Together?
Leading indicators point to what might happen next. Lagging indicators show what already took place. You need both to see the full picture.
Leading indicators help you take action before problems grow. They guide you in the right direction. Lagging indicators confirm if your actions worked. They tell you the result after everything plays out. You make better decisions when you connect both types. Understanding both helps you interpret broader economic indicators and assess how macro data drives business or trading outcomes.
Leading indicators push you forward. Lagging indicators pull lessons from the past. Do you measure both in your strategy?
If you are relying on one, it gives you half the story. You miss early warnings without leading signals. You miss accountability without lagging data. U
You should use both to give you control and clarity.
Application of Leading and Lagging Indicators in Risk Management
| Aspect | Leading Indicators | Lagging Indicators |
| Purpose | Predict potential risks before they occur | Measure the impact after risks have occurred |
| Timing | Show early warning signs | Show results after incidents |
| Action Type | Drive proactive responses | Support reactive analysis |
| Examples | Safety training rates, audit frequency, hazard reports | Injury counts, lost-time incidents, compensation claims |
| Decision Impact | Help reduce risk exposure early | Help assess the effectiveness of risk controls |
Do you include both types in your risk strategy? You need early signals to prevent problems. You also need hard data to evaluate what went wrong. A strong risk plan uses both. External conditions like interest rate changes or monetary tightening can also shape results. a clear example of policy impact on indicators.
How to Implement Leading And Lagging Indicators in Your Strategy?
You need a clear goal before tracking any indicator. Set your targets first. Then pick the metrics that align with those targets. You use leading indicators to spot early progress. You should choose actions that influence results. Focus on what moves your team forward. Select lagging indicators that confirm the outcome. Rely on facts, not assumptions.
Build a simple system to track both types. You need to use a dashboard or a clear report. Keep the data visible to everyone on the team. You check your indicators often. Remove the ones that no longer help.
Do you adjust your metrics when goals shift? Regular reviews keep your strategy sharp. A good balance of indicators keeps you prepared and focused.
Real-World Examples of Leading and Lagging Indicators
Sales teams track daily call numbers. That shows effort before results. Call volume acts as a leading indicator. Total sales at month-end show final performance. Sales numbers reflect a lagging indicator.
- Tech companies follow user sign-ups and feature usage. See, these actions come before revenue. They act as leading indicators. Monthly recurring revenue confirms results later. That serves as a lagging indicator.
- Manufacturing teams monitor safety training and audits. These actions come first. They help prevent accidents. Safety records and injury reports come after. Those reflect lagging indicators.
- Do you see the link between what you do and what you get? Leading indicators point you forward. Lagging indicators show what followed. You need both to improve results.
Turn Knowledge into Profit
You have done the reading, now it is time to act. The best way to learn is by doing. Open a free, no-risk demo account and practice your strategy with virtual funds today.
Open a Free Demo Account
Conclusion
You need both leading and lagging indicators to understand performance. Leading indicators show what may happen next. Lagging indicators reveal what already happened. Each type gives a different view. Leading indicators guide your actions. Lagging indicators confirm your results. You make better decisions when you use both together.
Do you track both in your strategy? A balanced approach helps you act early and measure outcomes. That’s how you stay ahead and keep improving.
FAQs
What our analysts watch: Three lenses dominate our reading of the equity tape. Sector rotation tells us where capital is moving (defensives versus cyclicals, value versus growth). Earnings revisions show whether analyst expectations are catching up to or trailing reality. Real yields and the dollar set the discount rate that valuation multiples respond to. When earnings estimates rise faster than the index price and real yields stabilise, the setup tends to favour patient longs.
Frequently asked questions
How much money do I need to start trading stocks?
Many regulated brokers now allow account opening with no minimum deposit and offer fractional shares for as little as $1. A practical starting balance for a long-only beginner is $500 to $2,000, enough to diversify across a handful of positions without paying meaningful percentage spreads. The FCA publishes investor education resources worth reading before opening an account.
What is the difference between stocks, ETFs, and CFDs?
A stock is direct ownership in a company. An ETF is a basket of stocks (or other assets) traded as a single security. A CFD (contract for difference) is a leveraged derivative that tracks the underlying price without conferring ownership. Each has different cost, tax, and risk profiles. ESMA imposes leverage caps on retail CFDs in the EU and UK.
How do I choose a trustworthy broker?
Verify regulation with a tier-one authority (FCA in the UK, BaFin in Germany, ASIC in Australia, CySEC for EU passporting, CBI in Ireland). Check segregated client funds, negative-balance protection, transparent fees, and a clean disciplinary record. Avoid any platform offering guaranteed returns or pressuring deposits. The FCA Financial Services Register is free.
Should I day-trade or invest long-term?
Most retail accounts that day-trade lose money over time. Long-term passive investing in diversified index ETFs has historically delivered competitive returns with far less effort and lower stress. Active day-trading can work, but it requires capital, an edge proven over hundreds of trades, and the time to monitor positions intraday. Start passive; layer active only after the basics are durable.
Related guides
Volity operates a trading platform and also publishes educational and analytical content about trading. The content on this page is for educational purposes only and should not be considered financial advice. Volity may benefit commercially when readers open trading accounts through links on this site.
Our content is produced and reviewed under documented editorial standards; comparison and review methodology is published here.


![How to Invest in Precious Metals: [Gold, Silver]](https://volity.io/wp-content/uploads/2024/12/Invest-in-Precious-Metals-like-gold-300x157.webp)


