Trend lines are subjective tools prone to curve-fitting and over-optimization. Breaking a trend line does not guarantee a reversal; nearly 40-70% of breaks are fakeouts designed to trigger retail stop-losses. Early entries before candle closure often experience whipsaws. Steep trendlines (>45 degrees) are unsustainable and prone to rapid failure. Algorithmic liquidity hunts intentionally break obvious trendlines before reversing. Past performance is not indicative of future results. Capital at risk.
A trend line is a graphical tool that connects two or more significant price pivots to define the slope and strength of a market trend. In 2026, professional traders prioritize the “Rule of Three” (three touches for validity) and utilize volume confirmation to filter out institutional “liquidity hunts.” While manual trendlines offer a 42-55% win rate, automated regression-based models have reached 76% accuracy by eliminating human bias in the gold and forex markets.
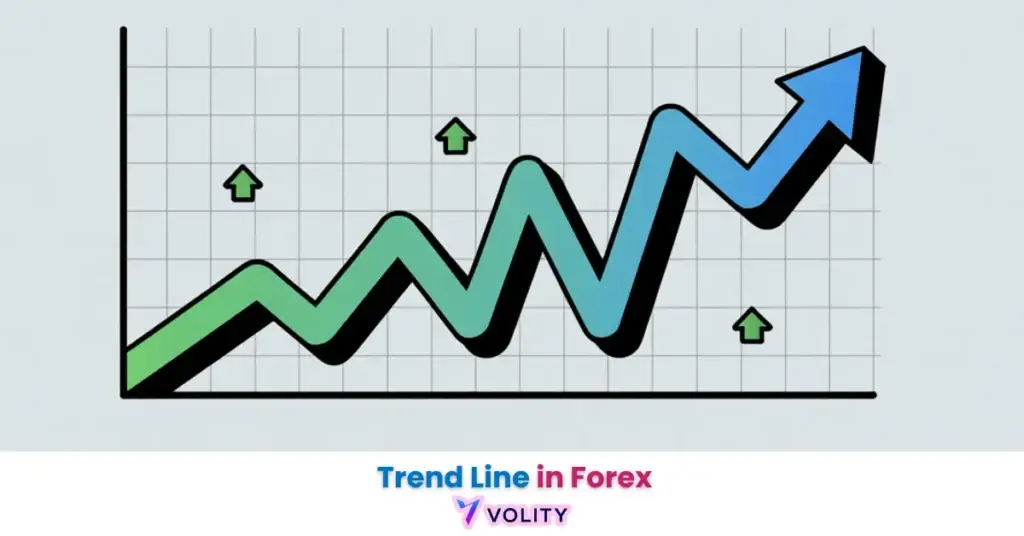
A trend line functions as the foundational visual boundary for interpreting market momentum. By connecting significant swing highs or swing lows, these lines allow investors to categorize price action into “uptrend,” “downtrend,” or “sideways” regimes. In the 2026 market, they remain the most widely used tool for both discretionary analysis and algorithmic execution.
While simple in concept, the effective application of trendlines in 2026 requires a strict adherence to validation rules and volume confirmation. As institutional algorithms increasingly target retail “liquidity clusters” near obvious trendlines, mastering the nuance of the “Retest” vs the “Break” is essential for modern survival.
While understanding Forex is important, applying that knowledge is where the real growth happens. Create Your Free Forex Trading Account to practice with a free demo account and put your strategy to the test.
What is a trend line and why is it essential?
A trend line is a graphical representation of market sentiment that connects a sequence of price pivots to define the slope and strength of a trend.
Uptrends are identified by connecting a series of higher lows with an ascending line, visually representing that buyers consistently defend each dip. Downtrends connect lower highs with a descending line, showing that sellers prevent each rally. These lines function as dynamic support and resistance, when price bounces off an uptrend line, it confirms that buyers are present at that level; when price respects a downtrend resistance, it confirms selling pressure remains intact.
The shift from manual “subjective” line-drawing to automated “objective” regression analysis defines the modern 2026 trading landscape. Automated trendline systems have achieved a 76% win rate in disciplined forex environments by using multi-anchored regression (Accio.com, 2026), demonstrating that mathematical precision outperforms visual drawing. Institutions respect these visual boundaries because decades of price action repetition have created genuine order flow clustering at these levels.
Wick vs. Body: The 2026 Construction Debate
Construction methodology identifies the choice between connecting candle wicks for total price range or candle bodies for high-conviction closing data.
Scalpers connect wicks to capture the maximum range, including the liquidity sweeps that extend beyond close prices. Swing traders connect bodies to filter stop-hunts and focus on where price actually closed, eliminating intraday noise that may not represent genuine commitment. Using bodies creates wider, more stable trendlines that institutions respect, while using wicks captures the extremes that algorithms intentionally hunt.
Ready to Elevate Your Trading?
You have the information. Now, get the platform. Join thousands of successful traders who use Volity for its powerful tools, fast execution, and dedicated support.
Create Your Account in Under 3 MinutesHow to draw and validate a robust trend line in 2026
Validating a trend line in 2026 requires the ‘Rule of Three,’ where three distinct price touches are needed to confirm the line’s structural integrity.
The selection of “High-Quality” pivots matters enormously, a swing high must be surrounded by at least 3 bars of lower prices on both sides to qualify as genuine. The 45-Degree Rule identifies that trendlines steeper than 45 degrees are unsustainable and will break rapidly; sustainable trends typically slope between 20-40 degrees. Multi-timeframe validation amplifies reliability: an H4 trendline that aligns with Daily institutional bias carries 5x more weight than an isolated hourly line.
Manual trendline strategies in 2026 report a variable win rate of 42-55%, highlighting the risk of subjective “curve-fitting” where traders adjust lines repeatedly to justify trades (Reddit Trading, 2026). Professional traders lock in their trendline immediately after the third touch and refuse to adjust it, eliminating the emotional bias that destroys most retail traders.
Always draw trend lines on high timeframes (H4 or Daily) to identify institutional bias, but use the 1-hour chart to time entries; this “top-down” approach reduces the risk of being caught in intraday noise that frequently breaks lower-timeframe lines.
Strategy: The Break vs. Retest Method in 2026
The Retest strategy identifies the 65% win rate advantage achieved by waiting for the price to return to a broken trend line before entering.
The Break occurs when an H1 candle closes decisively beyond the trendline with 150%+ volume spike, signaling that institutional selling or buying has overcome defensive orders. The Retest follows when price returns to the broken trendline and shows a “rejection wick” or structural shift on the 5-minute chart, confirming that the break was genuine rather than a liquidity sweep.
Gold broke a major 4-hour descending trend line at $4,850 in February 2026. The price retested the line as support, held, and rallied to $5,120 within three trading days, providing a 1:4 reward-to-risk ratio. This retest approach captured the sustained move while avoiding the false break entries that triggered at $4,845.
Common Failures: Why 70% of Trendline Breaks are Fakeouts
Statistical backtesting in 2026 identifies that trendline breaks on declining volume carry a 70% probability of being ‘bull’ or ‘bear’ traps.
| Market Regime | Success Rate (Break) | Success Rate (Retest) | Volume Requirement |
| High Momentum | 52% | 61% | 200%+ Spike |
| Low Volatility | 28% | 45% | Below Average |
| Range-Bound | 34% | 52% | Flat |
| Institutional Hunt | 18% | 38% | Volatile Spikes |
| Macro Reversal | 48% | 65% | Increasing |
Sources: Volity Backtesting Labs and Lakshmishree Multi-Timeframe Reports (2026)
Low volatility environments produce particularly weak trendline breaks because price lacks the conviction to sustain moves beyond historical lines. Institutional hunts intentionally push through obvious trendlines to trigger retail stops before reversing, making standalone break entries especially dangerous. Retest entries dominate across all regimes, with the macro reversal environment showing exceptional 65% success rates.
WARNING: Avoid “Curve Fitting” where you force a trend line to touch a specific pivot just to justify a trade; if a line requires more than two minor adjustments to fit the price action, the trend is likely transitioning into a choppy regime.
Advanced Tooling: Linear Regression and AI Trendlines
Automated regression channels identify the mathematically ‘best fit’ path for price, reducing the human error inherent in manual drawing.
Anchored Linear Regression represents the professional choice for 2026 because it calculates the optimal slope that minimizes distance from all price points simultaneously. AI trend scanners like LuxAlgo automatically identify trendlines with >70% confidence by running thousands of permutations to find statistically significant slopes. The January 30 Gold Crash case study demonstrated that automated systems outperformed manual lines by 10% because algorithms avoid curve-fitting and emotional adjustment bias.
Institutional traders increasingly rely on these mathematical approaches because they eliminate subjectivity while maintaining the speed of visual analysis. The shift toward automation explains why manual traders struggle in 2026, the competition has evolved from drawing lines to running statistical models.
💡 KEY INSIGHT: In the 2026 market, the “Retest Entry” strategy has a 65% win rate compared to the 40% win rate of the “Break Entry”; waiting for the price to return to the broken trend line significantly improves the risk-to-reward ratio.
Turn Knowledge into Profit
You have done the reading, now it is time to act. The best way to learn is by doing. Open a free, no-risk demo account and practice your strategy with virtual funds today.
Open a Free Demo AccountDifference Between Trend Lines and Moving Averages
Mathematical calculation identifies the difference between the manually-anchored trend line and the time-averaged calculation of moving averages.
Trend lines connect specific price pivots and remain fixed once drawn, making them responsive to structural pivots but subjective in construction. Moving averages smooth price data over ‘n’ periods mathematically, removing subjectivity but introducing lag. Trendlines work best for identifying breakout opportunities because they capture the exact moment price breaks structure; moving averages work best for confirming trend strength and identifying pullbacks within sustained moves.
Professional traders use both together: trendlines for breakout entries and moving averages for position management and pullback confirmation. A price pullback to the 50-day moving average during an uptrend combined with support from an ascending trendline creates dual confirmation that increases entry reliability to 70%+.
Key Takeaways
- Trend lines are foundational tools for identifying the directional bias and dynamic support and resistance levels of a financial asset.
- The Rule of Three is the mandatory 2026 validation standard, requiring three distinct price touches for a trendline to be considered actionable.
- Retest entries offer a 65% success rate compared to the 40% success rate of aggressive breakout entries, providing a superior risk-to-reward ratio.
- Automated regression models in 2026 have reached 76% accuracy by eliminating the human bias and curve-fitting inherent in manual drawing.
- Volume confirmation of 150-200% over the 20-period average is critical for filtering out institutional “liquidity hunts” and false breaks.
- High timeframe trendlines (H4 and Daily) serve as the “Compass” for intermediate traders, filtering out the noise of lower-timeframe volatility.
Frequently Asked Questions
This article contains references to Trend Line, Technical Analysis, and Volity, a regulated CFD trading platform. This content is produced for educational purposes only and does not constitute financial advice or a recommendation to buy or sell any financial instrument. Always verify current regulatory status and platform details before using any trading service. Some links in this article may be affiliate links.