Investing in financial products involves risk. Losses may exceed the value of your original investment.
Ulta stock earnings is a core topic for traders in 2026. The complete guide follows.
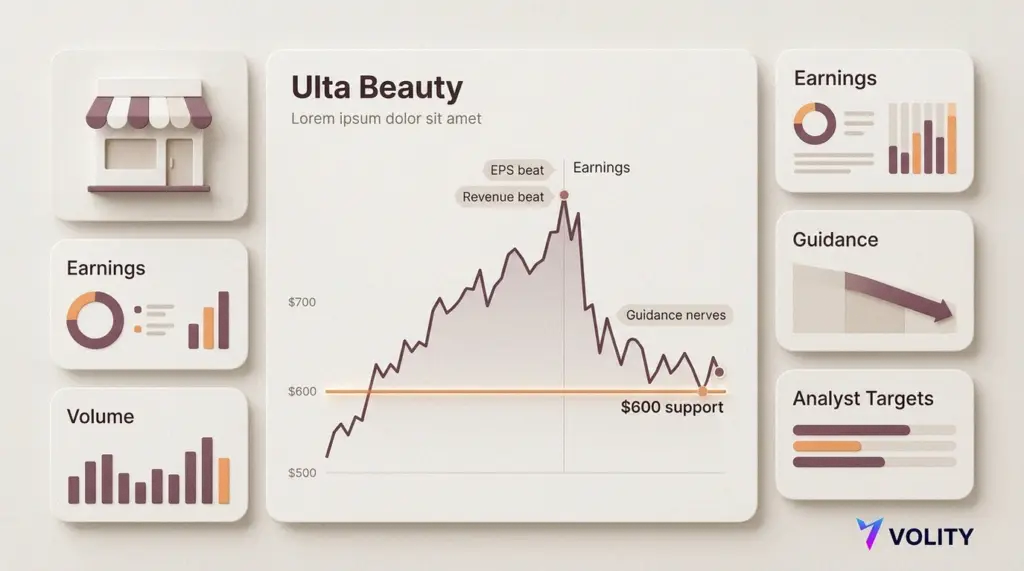
Ulta’s beat lands, but the stock slips on guidance nerves
Chicago – Ulta Beauty’s quarter looked like the sort that usually buys a rally. However, traders sold it anyway.
The retailer posted fourth quarter earnings of $8.01 a share, ahead of forecasts around $7.93. Meanwhile, revenue came in at $3.90bn, above the $3.81bn mark. Even so, the shares fell about 4.3% on Friday to roughly $625, and volume ran hot.
Markets often reward a clean beat. Yet this time, investors latched onto the next chapter. Management guided to fiscal 2026 earnings of $28.05 to $28.55 a share on sales of $13.1bn to $13.3bn. Those numbers sit above consensus estimates near $26.77 and $12.6bn. However, the tone around consumer demand mattered more than the maths.
Beauty has held up better than many discretionary categories. Nevertheless, traders worry the sector’s “little luxuries” story weakens if inflation stays sticky. Ulta’s own figures were strong. Return on equity sat around 46.33%, while net margins ran near 9.93%. Even so, the stock had rallied into the print, and the bar looked higher than the headline estimates suggested.
Analysts stay upbeat, but charts turn jumpy
On the sell side, optimism still dominates. Ulta carries a Moderate Buy style consensus, and several firms have lifted targets in recent days. Average targets cluster around the $638 area, while the median cited by a broad analyst set sits closer to the low $700s. Bulls argue that loyalty, store productivity, and a resilient category can keep comps steady.
Short term, though, technical traders saw a tidy setup. The selloff knocked the shares away from recent resistance, and it did so on heavy turnover. Meanwhile, momentum gauges that had looked stretched into earnings began to roll. Therefore, attention shifts to whether buyers defend the $600 area, which many desks view as the first line of support if selling persists.
That gap between analysts and traders is the story of the day. Analysts underwrite a multi quarter narrative. Traders, by contrast, trade the next two sessions. When the tape smells cautious guidance, it rarely waits for a long term thesis to catch up.
By the numbers
- Q4 EPS: $8.01 vs about $7.93 expected
- Q4 revenue: $3.90bn vs about $3.81bn expected
- FY2026 EPS guide: $28.05 to $28.55 vs about $26.77 expected
- FY2026 sales guide: $13.1bn to $13.3bn vs about $12.6bn expected
- Friday move: shares down about 4.3% to around $625
Key takeaways for traders
- Fade risk rises if the stock fails to reclaim the post print breakdown level early next week.
- $600 matters because it is the obvious near term line that dip buyers will defend.
- Watch volume because high turnover on down days can signal institutions de risk, not just profit taking.
- Guidance tone beats arithmetic when a stock has run up into earnings.
- Sector read through may hit peers if traders start pricing softer discretionary spend.
Ulta did what companies are supposed to do. It beat estimates and guided above the Street. However, the market answered a different question: is the consumer story getting tougher from here? Until that doubt clears, the shine on the beat may not be enough.
For more on this topic see our deep-dives on Brent Oil, UK Energy Stocks and Gold: Hedging Energy Shocks, Argan (AGX) Stock: Earnings, Power Demand and Buy Case, and Hot Stocks Today: AI, GPU Leaders and Earnings Momentum.
What our analysts watch: Three reads convert a single-session guidance reaction into a position thesis. Volume signature on the down day (heavy turnover with closing-print weakness signals institutional de-risking rather than retail profit-taking, which compresses the probability of a clean reversal in the following two sessions). Sector-correlation propagation (a discretionary peer that prints similar tone risk within the next two reporting weeks confirms the thesis as a sector read rather than a single-name event, which widens the trade lens to the broader consumer complex). Loyalty and store-productivity disclosure quality on the next earnings call (the durable bull case requires Ulta to convert the loyalty-programme metric into a measured contribution to comps; without that disclosure the multi-quarter narrative remains analyst projection rather than confirmed cash flow). The SEC EDGAR filings system publishes the full 10-Q and 10-K filings that anchor the disclosure read, the Investopedia reference on company guidance covers the cross-sector framework, and the Nasdaq market data tracks the live volume context. Volity offers U.S. and European equity CFD execution under CySEC oversight via UBK Markets (licence 186/12), with entities in Saint Lucia, Cyprus, and Hong Kong.
Frequently asked questions
Why does the 600 dollar level carry weight beyond round-number psychology?
Because it sits at the intersection of the post-print breakdown reference and the trailing accumulation zone from the prior consolidation, which is the structural feature that converts a psychological round number into an actionable bid level. The trade behaviour at 600 dollars is more informative than the absolute level: a tight intraday rejection with closing strength is the bid-defence signal, while a flat-to-weak close with continuation in the following session is the distribution signal that opens the path toward the deeper accumulation reference closer to 580 dollars.
How should traders read the Moderate Buy consensus against the post-print weakness?
The right framing is that the consensus reflects a multi-quarter narrative (loyalty, store productivity, category resilience) while the price action reflects the next two-session trade (cautious guidance, sector tone risk). The two readings are not in conflict; they price different time horizons. The disciplined response is to treat the analyst consensus as the structural reference and the post-print price action as the tactical reference, then size the position to the time horizon that matches the trade thesis rather than averaging the two reads.
What does heavy volume on a guidance-driven sell-off reveal about institutional positioning?
It reveals that the marginal seller is sized large enough to mark the close, which is the institutional fingerprint rather than the retail profit-taking pattern. Retail-driven down days typically show declining volume into the close as the panic cohort exhausts; institutional-driven down days show the volume signature on the closing print, which is the pattern that historically precedes follow-through rather than reversal. The volume signature is more informative than the percentage move for sizing the next-session probability.
Does the Ulta tape carry read-through to the broader discretionary sector?
It carries read-through that traders should weight against, not for. The discretionary sector trades on the relative-strength regime rather than the absolute consumer signal; a single-name guidance miss in beauty can spread through correlated long positioning even when the sector fundamentals remain intact. The right tactic is to monitor the next two discretionary peer prints for tone alignment; if peers print similar caution, the sector read confirms and position sizing on long discretionary tightens, while peer prints with confident tone reverse the read into a single-name disappointment rather than a sector signal.
Related guides
- Stocks investing for beginners
- Best stock trading platforms in Europe
- Swing trading platforms
- Day trading platforms
- Risk management
Volity operates a trading platform and also publishes educational and analytical content about trading. The content on this page is for educational purposes only and should not be considered financial advice. Volity may benefit commercially when readers open trading accounts through links on this site.
Our content is produced and reviewed under documented editorial standards; comparison and review methodology is published here.