Trading trending markets amplifies losses when trend reversals occur without warning; premature entries before confirming ADX > 25 expose traders to whipsaws. Over-reliance on the 200-day SMA ignores fundamental policy shifts that invalidate long-held trends overnight. Mean-reversion crashes following parabolic extension (3+ standard deviations above the 50-day EMA) occur without notice, triggering catastrophic stop-outs if positions remain exposed. Crypto trends are vulnerable to regulatory shocks and exchange failures that create artificial gaps below support zones. Past performance is not indicative of future results. Capital at risk.
Following the trend is not a new idea. The early twentieth-century speculator Jesse Livermore built his reputation on trading with the market direction rather than fighting it.
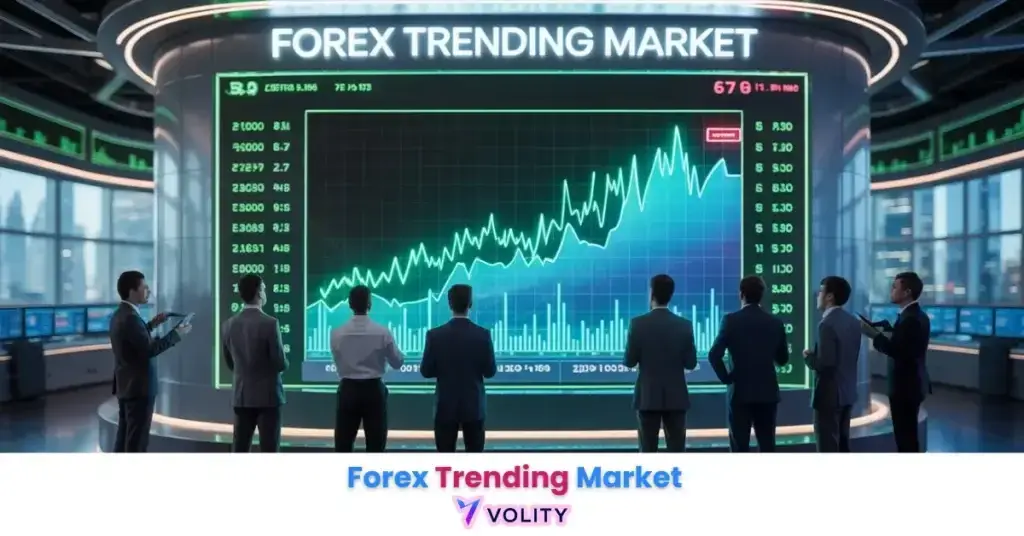
A trending market is a market regime characterized by a consistent sequence of higher highs and higher lows (uptrend) or lower highs and lower lows (downtrend). In 2026, professional success relies on identifying “Multidimensional Polarization,” where macro bull runs remain intact while individual tradeable moves have shortened to 3-5 months due to AI execution. Utilizing ADX > 25 and the 200-day SMA as primary filters ensures traders stay aligned with high-conviction institutional momentum.
A trending market functions as the primary environment for high-probability investment returns. These regimes are defined by a persistent directional flow where price action consistently creates new highs or new lows over a specific timeframe. In the 2026 trading landscape, identifying the transition from consolidation to a trending state is the benchmark for institutional-grade execution.
The rise of high-frequency AI algorithms has transformed trend dynamics, leading to a phenomenon known as “Multidimensional Polarization.” While long-term macro trends endure for years, individual tradeable swings have compressed, requiring a more agile approach to trend verification and risk management.
While understanding Trending Market is important, applying that knowledge is where the real growth happens. Create Your Free Forex Trading Account to practice with a free demo account and put your strategy to the test.
What is a trending market and how does it function in 2026?
A trending market is a directional price regime where market participants exhibit a consistent preference for buying or selling, resulting in a series of ascending or descending pivots. The pattern establishes clear support and resistance levels that reinforce the prevailing bias. In 2026, these regimes serve as the foundation for all institutional trend-following strategies.
- Uptrends: Higher Highs (HH) and Higher Lows (HL) indicating bullish dominance.
- Downtrends: Lower Lows (LL) and Lower Highs (LH) indicating bearish dominance.
- The 2026 “Multidimensional Polarization”: How multi-year bull runs are now composed of faster sector rotations lasting a few months each.
Macro equity trends can run for years at a time, which is exactly what gives long-horizon trend-following its edge over short-term prediction. That persistence reflects the institutional demand that underpins multi-year positioning. The Market trend reference sets out the standard secular, primary and secondary classification these horizons come from.
The Anatomy of a Momentum Cycle
Momentum cycles identify the three phases of a trend: institutional accumulation, retail participation, and blow-off exhaustion. The accumulation phase occurs when large institutions quietly acquire positions at the trend’s early stages, this phase is silent and shows low volume. Retail participation accelerates as retail traders observe the technical pattern forming and fear missing the move. The blow-off exhaustion phase represents the final emotional capitulation, where traders chase the trend at peak momentum, this is the phase most prone to reversal.
The role of volume in confirming the “Retail” phase is critical. When trading volume spikes on a trend acceleration without a corresponding increase in price momentum, the exhaustion phase is near. Why 2026 trends are increasingly front-run by AI sentiment bots reflects the algorithmic execution speed of institutional traders, modern AI can identify retail accumulation patterns within microseconds and position ahead of them.
Ready to Elevate Your Trading?
You have the information. Now, get the platform. Join thousands of successful traders who use Volity for its powerful tools, fast execution, and dedicated support.
Create Your Account in Under 3 MinutesHow to identify a trending market using 2026 Technical Tools
Technical identification of a trending market requires the alignment of price action with trend-strength indicators like the ADX and the 200-day SMA. The 200-Day SMA serves as the institutional “North Star” for defining the macro trend direction. This moving average is the level where major banks have algorithmic buy orders resting during uptrends, making it the most reliable support zone. ADX (Average Directional Index) readings require a value above 25 to confirm a “strong” trend, below 25 indicates a ranging or choppy market unsuitable for trend-following strategies. The indicator was published by J. Welles Wilder Jr. in 1978 as a measure of trend strength rather than trend direction (Average directional movement index).
RSI (Relative Strength Index) levels above 50 confirm bullish momentum and below 50 confirm bearish momentum. ATR (Average True Range) calibrates stop-losses to current realized volatility, ensuring risk management adapts to market conditions. Realized volatility on Bitcoin moves through long compression and expansion phases, and the ATR reading tells you which one you are in. When realized volatility compresses, stops can sit closer to price without being taken out by noise; when it expands, position size has to come down to hold risk constant.
You can use Technical Indicators for Trading to explore additional confirmation tools beyond ADX. The SMA Trading guide offers detailed entry strategies around moving average levels. Additionally, Aroon Indicator provides an alternative trend-strength measure when ADX diverges from price action.
In the 2026 market, prioritize “Regime Awareness” over simple indicator signals; a trend is only “Valid” if the ADX is above 25 and the price is trading outside the 20-period Bollinger Band “Squeeze” zone.
Strategy: The 2026 Trend-Following Playbook
The 2026 trend-following playbook identifies the ‘Pullback to Value’ method as the most consistent strategy for entering established trends. This approach waits for price to retrace toward a key moving average during an uptrend, then enters on the confirmation that buyers have defended the level. The three professional methods include:
Illustration of the rule, not a recorded trade: when a reserve currency peaks and then rolls over while its central bank turns easier than its peers, the resulting move is the kind of multi-month regime that trend-following is designed to capture. The position is held with a trailing stop rather than a fixed target, because the whole edge lies in staying in while the divergence persists. Past performance is not indicative of future results.
Performance Comparison: Trending vs. Ranging Markets
Trending environments suit momentum strategies for a structural reason rather than a statistical one: a directional bias gives an entry somewhere to go. Trending regimes amplify the effectiveness of technical indicators because price action confirms indicator signals. Ranging markets create false breakouts where technical patterns fail to deliver moves.
| Asset Class | Typical Trend Horizon | Best Indicator | What the Regime Rewards |
| Blue-Chip Stocks | Multi-year macro | 200-Day SMA | Wide stops and patience |
| Forex (Majors) | Months, set by the policy cycle | ADX + ATR | Carry plus momentum |
| Crypto (BTC) | Weeks to months, volatility-driven | 50-Day EMA | Volatility-scaled position sizing |
| Tech Sector | Sector rotations of a few months | VWAP | Rotation timing |
| Commodities | Months, tied to the supply cycle | Ichimoku Cloud | Seasonality and inventory |
The horizons and indicator pairings above are descriptive market conventions, not backtested performance statistics.
WARNING: Beware of “Parabolic Overextension” in crypto and tech stocks; trends that stretch several standard deviations from their 50-day EMA in a matter of days tend to snap back hard, and the further the stretch the more violent the reversion.
The Impact of “Policy Divergence” on 2026 Trends
Central bank policy divergence identifies the primary fundamental driver for long-term trending regimes in the global forex market. Fed Rate Cycles shaped how USD depreciation in 2025-2026 was driven by the Fed’s pivot to cuts while other central banks remained hawkish. Relative Strength between the ECB and BoJ normalization versus U.S. easing creates structural opportunities, the ECB tightening while the Fed cuts widens the EUR/USD spread dramatically.
Carry Trades fuel trends through investors seeking higher-yielding currencies. When interest rate differentials widen, capital floods into the currency with the higher yield, creating a self-reinforcing trend. The “Policy Divergence” between central banks in 2026 has created 12-36 month trends in major forex pairs like EUR/USD, providing a high-probability backdrop for carry-trade and momentum strategies. Fundamental Analysis provides deeper context on how policy shapes currency trends.
💡 KEY INSIGHT: The “Policy Divergence” between central banks in 2026 has created 12-36 month trends in major forex pairs like EUR/USD, providing a high-probability backdrop for carry-trade and momentum strategies.
Turn Knowledge into Profit
You have done the reading, now it is time to act. The best way to learn is by doing. Open a free, no-risk demo account and practice your strategy with virtual funds today.
Open a Free Demo AccountCommon Failures: Why Trends Reverse in 2026
Exhaustion regimes represent the primary failure mode for trending markets, often triggered by extreme RSI divergence or ‘Liquidity Sweeps’. The “Bull Trap” occurs when price makes a higher high but RSI makes a lower high, this divergence signals that momentum is fading despite the new price extreme. Geopolitical de-escalation is the classic trend invalidator in gold: a metal that has rallied for months on risk premium can hand back a large part of that move in hours once the premium is priced out. No technical signal precedes it, which is why the stop has to be in the market before the headline is.
Risk management failures account for most trend-trading losses. Traders who fail to place stops beyond the formation’s extremes expose themselves to liquidity sweeps that target retail stop-loss clusters. Risk Management in Trading and Market Volatility both address how to structure exits that survive modern market microstructure.
Key Takeaways
- Trending markets are market regimes defined by a consistent sequence of higher highs and higher lows, providing a clear directional bias for traders.
- Multidimensional Polarization is a 2026 trend where macro bull markets remain strong for years, while individual tradeable sectors rotate every 3-5 months.
- The 200-day SMA serves as the institutional “North Star” for identifying the primary trend direction and defining high-probability support levels.
- ADX readings above 25 are mandatory for verifying trend strength and filtering out the choppy, sideways markets that cause “whipsaws.”
- Policy divergence between central banks remains the primary fundamental driver for 12-36 month trends in the global forex and bond markets.
- Parabolic overextension is the standing warning: trends that stretch far from their 50-day EMA in a short window are the ones most prone to a sharp mean-reversion correction.
Frequently Asked Questions
This article contains references to Trending Market, Multidimensional Polarization, and Volity, a regulated CFD trading platform. This content is produced for educational purposes only and does not constitute financial advice or a recommendation to buy or sell any financial instrument. Always verify current regulatory status and platform details before using any trading service. Some links in this article may be affiliate links.