Investing in financial products involves risk. Losses may exceed the value of your original investment.
Gold price outlook is a core topic for traders in 2026. The complete guide follows.
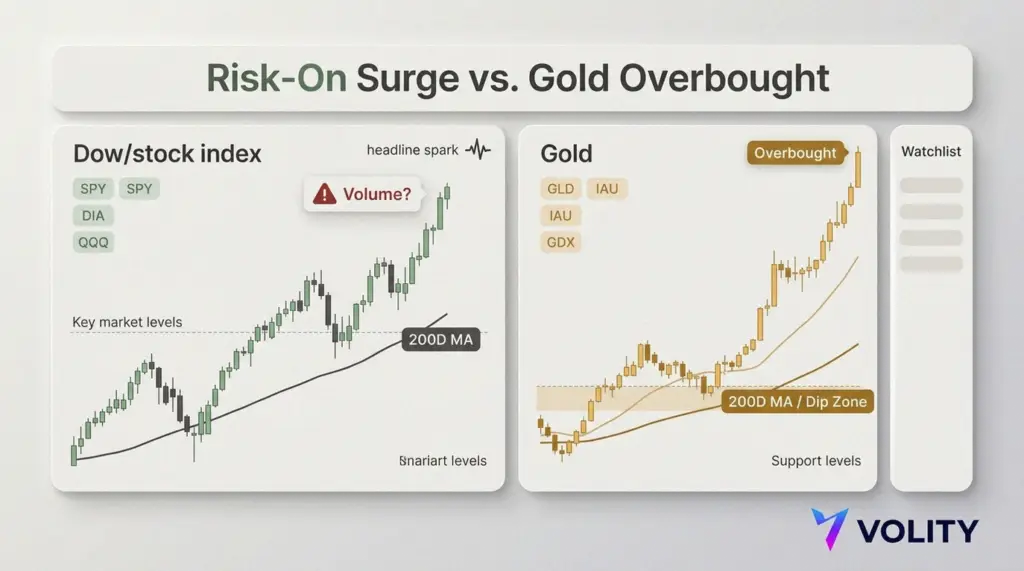
Market momentum watch: gold’s overbought trap and the hottest stock plays
Risk-on returned with a thump, and it did not wait for permission. Fresh de-escalation around Iran pushed the Dow up about 800 points, while futures later hinted at an even louder open. Meanwhile, the chase spread fast across SPY, DIA and QQQ, as traders priced out the tail risk and leaned into beta.
However, the tape still has a catch. The S&P 500 and Nasdaq have only just reclaimed their 200-day moving averages, which often acts like a bouncer at the door. Therefore, if volume does not show up, the next move can be a fade, not a follow-through. That is especially true when the move feels headline-driven, rather than earnings-driven.
Gold, for its part, looks like the mirror image of equities. The old “oversold” storyline has expired, and the metal has started to behave like a crowded trade. Although long-term bulls can still cite end-year targets, the near-term setup now looks like an overbought reset, not a fresh breakout.
Gold’s reality check: from rally to reversal
Gold’s recent price action has been violent. Spot gold sank to about $4,551 an ounce on 19 March after flirting with record territory near $5,289 earlier in March. That type of one-day air pocket tends to leave technical damage, even if the longer trend stays intact.
Meanwhile, the positioning around the miners and the big bullion ETFs has looked stretched. GLD and IAU, plus miners via GDX, have traded far above their 200-day averages, with momentum gauges flashing levels that usually precede digestion. Additionally, chart watchers have pointed to a break of the prior bullish channel, with the market now wrestling with resistance near $4,955.
Therefore, the cleaner setup may be patience. If gold keeps leaking lower, a pullback towards the 200-day area near $3,969 looks like a more rational zone for dip buyers. In contrast, chasing bounces above the $5,000 handle risks paying retail prices for wholesale momentum.
Crude’s softer tone, helped by the same de-escalation impulse, also removes some inflation heat from the story. Hence, energy geopolitics may stop supporting gold at the margin, at least in the short run. That shift also makes long oil-levered trades less forgiving, as producers can wobble when the fear premium comes out.
Trade lens
- Bias: fade strength in GLD and GDX after sharp bounces.
- Risk: respect headline spikes, as geopolitics can still gap the market.
- Focus: watch the 200-day area as a potential re-entry zone, not a guarantee.
Equity momentum: green lights, with volume as the judge
Equities, by comparison, have a simpler pitch. When fear comes out, traders buy what moves and what has a catalyst. Yet the market is still close enough to key moving averages that confirmation matters. Consequently, the best trades often show their hand early in the session, with volume that does not fade after the first hour.
Several single-name setups stand out because they marry a news hook to a chart that can move. Still, each needs the same discipline: enter only if price clears a level with real participation, then cut quickly if the breakout turns into a bull trap.
Day trader watchlist
- COF – lawsuit dismissal clears an overhang; watch for a clean break above recent highs.
- SNPS – activist involvement adds spark; buy momentum only if the breakout holds on volume.
- FLUT – regulatory pressure on rivals can redirect flows; scalp pullbacks rather than chase spikes.
- APGE – Phase 3 eczema data creates binary-style momentum; treat it as a breakout watch, with tight risk.
- ASPI – early drilling results can pull in resource traders; look for follow-through, not one candle.
- AEO – battered but interesting; value dip-buy can work if it stops making new lows.
Meanwhile, some popular names flash mixed signals. APA has shown divergence risk that often precedes a pullback, even if the broader trend stays up. SNOW cost cuts may help margins, yet sentiment can swing hard on AI narratives. Therefore, avoid marrying the trade, and treat each as a rental with a stop.
Indices and levels: the rally is real, and also vulnerable
The Dow has held above key moving averages, and momentum indicators have been strong. However, RSI readings north of 75 often mean the market is running hot, not safe. Additionally, when the S&P and Nasdaq are only just reclaiming their 200-day lines, the risk is a fast rejection that catches late buyers.
So the practical game plan is simple. Trade the strength, but demand proof. If the market cannot hold reclaimed levels into the close, trim risk and expect chop. Conversely, if breadth improves and volume expands, the same 200-day lines can flip from resistance into support.
By the numbers
- Dow: +800 points on the de-escalation burst; futures later hinted at a larger move.
- Gold: roughly $4,551 on 19 March after early March highs near $5,289.
- Gold buy zone idea: 200-day area cited around $3,969.
- Key index tell: S&P 500 and Nasdaq just above their 200-day moving averages.
Key takeaways
- Gold: treat rallies as sellable until it resets closer to longer-term support.
- Equities: size up only after volume confirms the 200-day reclaim.
- Watchlist: focus on catalyst names that can trend intraday, not just gap.
- Energy: fading geopolitics can punish complacent oil bulls.
- Risk: headline markets reverse quickly, so stops matter more than forecasts.
For more on this topic see our deep-dives on BMNR and PTON: Ethereum Treasury Plays and Breakout Setups, QQQ Momentum and Tech: How Gold and Bitcoin Shape Risk Sentiment, and SolarEdge Stock Jumps as Jefferies Lifts Price Target on SEDG.
What our analysts watch: Three readings frame the gold-versus-Dow trade. The 14-day RSI on the Dow above 70 is a threshold (not a sell signal, but a positioning warning).
The real 10-year US Treasury yield (TIPS-implied) is the primary gold driver; falling real yields with rising nominal yields is the strongest gold setup. Central-bank gold demand from World Gold Council quarterly data is the slow-burn flow that has structurally repriced gold over the past three years.
Overbought equity readings rarely cause selloffs alone; they cause selloffs when paired with deteriorating earnings revisions.
Frequently asked questions
Why does gold rally when equities are overbought?
Overbought equities often coincide with stretched positioning and elevated complacency. Capital marginally rotates into hedges (gold, the dollar in some regimes, long-duration bonds in others) without yet exiting the equity trade. Persistent gold strength while the Dow drifts higher signals diversification, not yet a top. The World Gold Council publishes flow data that supports this view.
What is the relationship between real yields and gold?
Gold has no coupon, so the opportunity cost of holding it is the real yield on inflation-protected Treasuries. When real yields fall, gold rises; when real yields rise, gold faces headwinds. This is the cleanest single relationship to track. The Federal Reserve publishes TIPS yield curves and inflation breakeven data daily.
Is RSI above 70 a reliable sell signal for the Dow?
No, by itself. RSI above 70 indicates strong momentum, not an exhaustion top. The signal becomes useful when paired with declining breadth, falling earnings revisions, or rising volatility (VIX above 20). Investopedia covers RSI mechanics and common misuse patterns.
How can I trade the gold-equity divergence on Volity?
Volity supports spot gold (XAU/USD), gold CFDs, US equity indices and individual equities through UBK Markets (CySEC licence 186/12) with our Saint Lucia, Cyprus and Hong Kong entities. You can express a long-gold short-Dow pair, hedge with FX, and run the relative-value trade in one regulated account.
Related guides
- Gold trading platforms
- Top books on gold trading
- Indices trading platforms
- Stocks investing for beginners
- Risk management
Volity operates a trading platform and also publishes educational and analytical content about trading. The content on this page is for educational purposes only and should not be considered financial advice. Volity may benefit commercially when readers open trading accounts through links on this site.
Our content is produced and reviewed under documented editorial standards; comparison and review methodology is published here.
For a full walkthrough, see our guide to trading gold.