The Spinning Top Candlestick is a vital pattern in technical analysis, signaling market indecision with its small real body and long wicks. While it doesn’t guarantee a reversal, it highlights a potential pause or pivot in the existing trend. This guide will teach you how to accurately identify bullish and bearish spinning tops, understand their context, and integrate them into a robust trading strategy with proper risk management to avoid false signals.
While understanding Spinning Top Candlestick Pattern is important, applying that knowledge is where the real growth happens. Create Your Free Forex Trading Account to practice with a free demo account and put your strategy to the test.
What is a Spinning Top Candlestick Pattern?
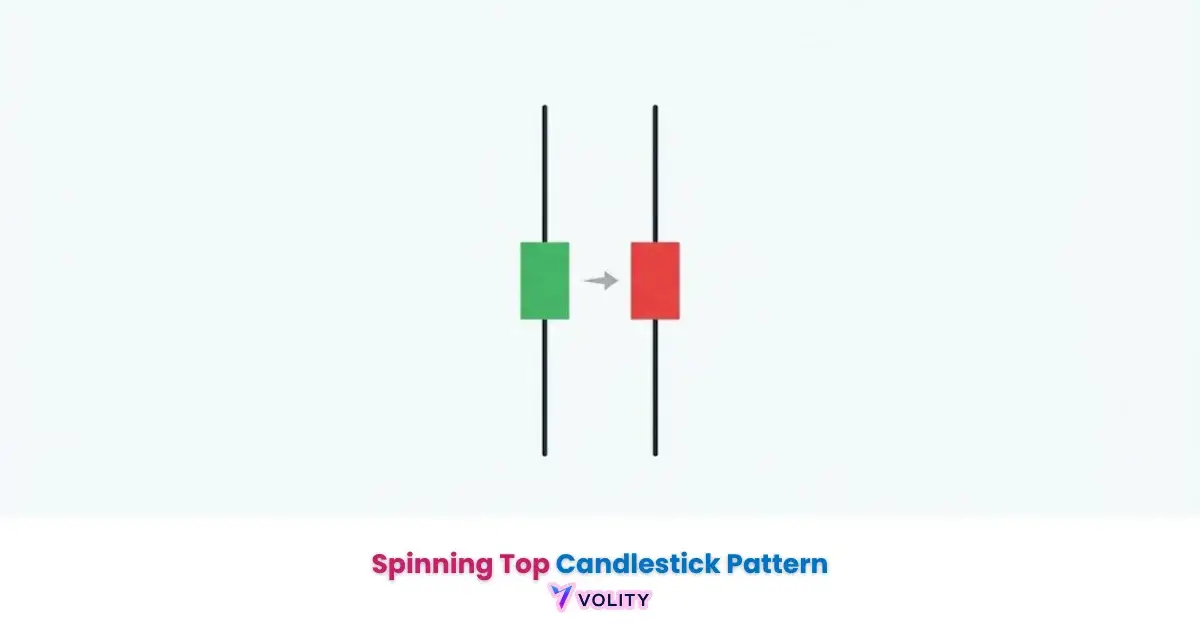
A spinning top candlestick is a single candlestick pattern characterized by a small real body and relatively long upper and lower wicks. This formation indicates that the opening and closing price were very close to each other, despite significant price action between the high and low of the period. A spinning top candlestick indicates market indecision, where buyers and sellers are equally matched, leading to little net price movement. This balance of power is crucial for understanding its implications in technical analysis.
How does a spinning top form?
A spinning top forms when the market experiences significant price fluctuations within a trading period, but the opening and closing price remain close. This creates a small real body, which can be either bullish (green/white) or bearish (red/black), depending on whether the close was slightly above or below the open. The long upper wick and long lower wick signify that prices moved considerably higher and lower, but ultimately returned near the opening level. This vigorous, yet ultimately inconclusive, price action is what defines its formation.
What does a spinning top indicate?
A spinning top primarily indicates market indecision. It suggests that the forces of buyers and sellers are in equilibrium, with neither side able to gain a decisive advantage. This can signal a potential pause in a strong trend, a period of consolidation, or a precursor to a potential trend reversal. A spinning top does not, by itself, guarantee a reversal; rather, it highlights a moment of uncertainty where the previous trend might be losing momentum. Addressing a common misconception, a spinning top is not always a reversal signal.
Spinning Top vs. Doji Candlestick
Both the spinning top and the Doji candlestick patterns signal market indecision, but they differ fundamentally in their formation and the degree of indecision they represent. Understanding these nuances is crucial for accurate technical analysis. The key distinction lies in the size of their real bodies, which provides insight into the precise balance between buying and selling pressures.
Spinning top vs Doji?
The primary difference between a spinning top and a Doji candlestick lies in their real bodies. A spinning top has a small real body, indicating that the opening and closing prices were close but not identical, suggesting a slight bias, even if indecision prevails. A Doji, in contrast, has virtually no real body, meaning the open and close prices were identical or nearly identical, signaling absolute indecision. This subtle distinction impacts their interpretation in a trading strategy.
Ready to Elevate Your Trading?
You have the information. Now, get the platform. Join thousands of successful traders who use Volity for its powerful tools, fast execution, and dedicated support.
Create Your Account in Under 3 MinutesBullish & Bearish Spinning Tops: Context is Key
Spinning tops can appear as either bullish spinning top or bearish spinning top, depending on the color of their small real body. However, their significance is primarily derived from their context within the broader market trend. While they can precede a potential trend reversal, they can also signal trend continuation after a period of consolidation.
What is a bullish spinning top?
A bullish spinning top forms when the closing price is slightly above the opening price, resulting in a small green or white real body. When this pattern appears at the bottom of a downtrend, especially near a support and resistance level, it suggests that the selling pressure is waning, and buyers are beginning to assert themselves. This indicates a potential trend reversal from bearish to bullish, though next candle confirmation is essential. The presence of a long lower wick in this context can further emphasize a rejection of lower prices.
What is a bearish spinning top?
A bearish spinning top forms when the closing price is slightly below the opening price, resulting in a small red or black real body. If this pattern emerges at the top of an uptrend, particularly around a resistance level, it signals that the buying momentum is weakening. Sellers are now stepping in, indicating a potential trend reversal from bullish to bearish. Similar to its bullish counterpart, a long upper wick here signifies a rejection of higher prices, but traders must wait for next candle confirmation before acting.
Spinning Tops in Different Market Phases
Spinning tops are not exclusively found at market tops or bottoms; they can also appear during various market phases. When a spinning top forms during an established trend, it often signals a period of consolidation or sideways movement. This means the market is taking a pause, with neither buyers and sellers currently dominating. Following such a consolidation, the previous trend might resume, leading to trend continuation. Therefore, the interpretation of a spinning top is heavily dependent on the preceding price action and the overall market structure.
How to Trade the Spinning Top Candlestick Pattern
Trading the spinning top candlestick pattern effectively requires more than just identifying the pattern itself. It demands a robust approach that integrates additional technical analysis tools and stringent risk management. While a spinning top signals potential shifts, its inherent indecision means it carries a low reliability as a standalone signal. Relying solely on a spinning top can lead to premature entries and false signals. Traders often look for a strong candle in the opposite direction of the prior trend, ideally with high volume, to confirm the spinning top’s indication.
When to enter/exit a trade with a spinning top?
An entry point for a trade following a spinning top should only be considered after confirmation signals. If a bullish spinning top appears in a downtrend, a confirmed entry might be above the high of the subsequent bullish candle. Conversely, for a bearish spinning top in an uptrend, an entry could be below the low of the next bearish candle. The exit strategy should involve predetermined profit targets and a disciplined stop loss placement. Profit targets can be set at significant support and resistance levels or based on a favorable risk-reward ratio, such as 1:2 or 1:3.
What are the risks of trading spinning tops?
Trading spinning tops carries inherent risks due to their nature as signals of indecision. The primary risk is misinterpreting the pattern as a definitive reversal when it only indicates a pause, leading to premature entries against the prevailing trend. This can result in significant losses if the market resumes its original direction. Without proper confirmation signals and disciplined risk management, traders might find themselves caught in false signals or choppy market conditions. Emotional biases can also amplify these risks, pushing traders to act on weak signals.
Common Challenges & Avoiding False Signals
Many traders ask, “Why do my spinning top trades often fail?” The answer frequently lies in the pattern’s inherent ambiguity and the pervasive influence of psychological factors. Spinning tops, by their nature, are prone to generating false signals if not interpreted within a comprehensive technical analysis framework. This section addresses these common challenges, offering insights often overlooked by basic guides.
Why do my spinning top trades often fail?
- Spinning top trades often fail because the pattern itself only signals market indecision, not a guaranteed potential trend reversal.
- Without robust confirmation signals from subsequent price action, volume, or other indicators, the spinning top can easily lead to false signals.
- Traders frequently misinterpret a temporary pause or sideways movement as a definitive reversal, entering trades prematurely against the prevailing trend.
- This issue is compounded by market noise and a lack of contextual understanding, leading to suboptimal trade outcomes.
Overcoming Psychological Biases in Trading
Psychological factors play a significant role in how traders interpret and act on candlestick patterns like the spinning top. Emotional biases, such as fear of missing out (FOMO) or revenge trading, are common psychological factors that lead traders to misinterpret or prematurely act on candlestick signals, including the spinning top. Impatience can cause traders to jump into a trade without waiting for next candle confirmation, while overconfidence can lead to ignoring crucial risk management rules. Developing emotional discipline, adhering to a strict trading plan, and understanding one’s own biases are critical steps to overcome these pitfalls.
Advanced Confirmation Techniques
To mitigate false signals and improve the reliability of spinning top patterns, traders can employ advanced confirmation techniques. Beyond simple volume analysis, consider using multiple timeframe analysis. A spinning top on a daily chart might gain more significance if the hourly chart also shows signs of exhaustion or divergence in momentum indicators like RSI or MACD. Confluence with significant support and resistance levels, Fibonacci retracements, or even order flow analysis can provide stronger confirmation signals, validating the indecision suggested by the spinning top and reducing trading risks.
Turn Knowledge into Profit
You've done the reading, now it's time to act. The best way to learn is by doing. Open a free, no-risk demo account and practice your strategy with virtual funds today.
Open a Free Demo AccountIntegrating Spinning Tops into Your Trading Strategy
Successfully integrating spinning tops into a trading strategy moves beyond simple identification to a holistic approach involving indicator confluence, real-world application, and rigorous validation. This allows traders to leverage the pattern’s insights into market indecision more effectively, improving overall technical analysis.
Best strategies for trading spinning tops?
The best strategies for trading spinning tops involve combining them with other technical analysis indicators. For example, a bullish spinning top appearing at a support level, confirmed by a bullish divergence on the RSI, significantly strengthens the reversal signal. Similarly, a bearish spinning top at resistance, coupled with a bearish MACD crossover, enhances the probability of a downward move. This confluence of signals creates a more robust trading setup, filtering out weaker signals and improving trade accuracy.
Real-World Case Studies with Nuanced Outcomes
Consider a bullish spinning top appearing after a significant downtrend on a daily timeframe chart, just above a historical support and resistance level. The next day, a large green candle opens higher and closes significantly above the spinning top’s high, accompanied by surging volume. This is a strong confirmation signal, indicating a high probability of an upward potential trend reversal. Conversely, a bearish spinning top at the peak of an uptrend, followed by a small, indecisive candle, might lead to a false signal if the trend subsequently resumes upwards. These nuanced outcomes emphasize that context and next candle confirmation are paramount.
Validating Strategies with Backtesting and Algorithms
- To truly master the spinning top candlestick pattern, traders should engage in historical backtesting to validate their strategies.
- For advanced users, the logic behind identifying spinning tops and their confirmation signals can be incorporated into algorithmic trading signals.
- This allows for automated scanning of markets for potential setups, removing emotional biases and enabling systematic execution of strategies.
- Consistent profitability comes from a disciplined approach, not from relying on single patterns. Use spinning tops as an alert, then confirm with other tools.
Key Takeaways
- The Spinning Top Candlestick signals market indecision, characterized by a small real body and long wicks.
- Its interpretation is highly dependent on market context, indicating either a potential reversal or consolidation.
- Always seek confirmation from subsequent price action, volume, or other technical indicators before trading.
- Avoid common mistakes like misinterpreting the pattern as a definitive reversal or neglecting risk management.
- Integrate spinning tops into your strategy by combining them with other tools and validating through backtesting.