Investing in financial products involves risk. Losses may exceed the value of your original investment.
Qqq momentum tech is a core topic for traders in 2026. The complete guide follows.
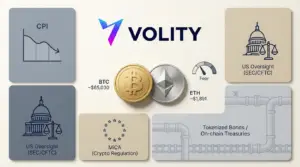
Momentum traders bid up big tech, while gold flirts with records
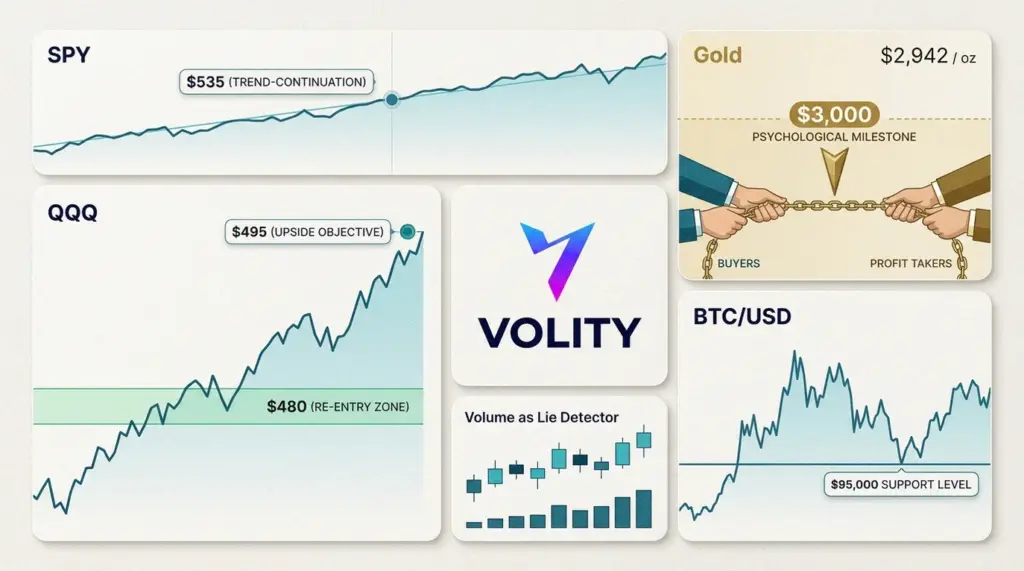
US equities pushed higher into the afternoon, and the tape felt clean rather than frantic. The S&P 500 ETF SPY gained 0.8%, while the Nasdaq 100 ETF QQQ led with a 1.2% rise. Meanwhile, gold kept stealing glances at the record book, with the metal hovering near $2,942 an ounce and the SPDR Gold Shares GLD tracking the move.
However, the more interesting story for traders was not the headline percentages. It was the way money behaved. Buyers stayed present on minor dips, and sellers struggled to press momentum names below morning support. Therefore, the day rewarded the oldest play in the book: wait for strength, buy the pullback, then sell into extension.
QQQ acted like the day’s steering wheel. Mega-cap tech and AI-linked names held the bid, and that steadiness matters. When QQQ drifts higher with shallow pullbacks, index liquidity often becomes a tailwind for intraday breakouts elsewhere. Meanwhile, SPY ground up in a broader, less dramatic fashion, which tends to suit disciplined risk sizing.
Gold’s rally carried a different flavour. Traders pointed to tariff delays and growing chatter about rate cuts as supportive conditions.
Yet the key detail was price, not the narrative. Gold at these levels attracts trend followers and profit takers in equal measure.
Therefore, continuation setups tend to work best on controlled pullbacks, not on first-touch highs.
What traders watched today
- QQQ stayed firm on dips, and traders talked about a developing golden-cross structure.
- SPY climbed with a steadier profile, which often hides multiple sector rotations beneath the surface.
- GLD tracked spot gold near $2,942, keeping $3,000 as the obvious psychological magnet.
- BTC/USD was discussed as holding $95,000 support, reinforcing the broader risk-on tone.
- DIA sat in the background as a potential rotation vehicle if traders trim tech exposure.
Setups in focus into the close
QQQ remained the cleanest momentum proxy. Traders looked for dips towards $480 as a potential re-entry zone, with $495 cited as an upside objective.
However, the more practical rule was simpler. If the ETF held above its last intraday higher low, dip-buyers kept the advantage.
If it lost that level on volume, the move risked turning into an afternoon fade.
SPY drew attention around the $535 area as a line-in-the-sand for trend continuation. It is not a magic number. Yet round zones often become self-fulfilling when enough traders anchor to them. Therefore, any late-day push through resistance without broad participation would have looked fragile.
GLD offered a different tempo. Trend traders prefer gold when it marches higher in steps, not spikes. Therefore, the cleaner continuation trade usually comes after a pullback that respects the prior breakout area, rather than chasing the first print near a record.
Screening, without the theatre
Momentum traders kept it basic. They favoured names up 5%+ on at least 2x typical volume, and they cared most about the first hour’s structure.
Pennants, gap pullbacks, and fresh five-day highs still do most of the work. Meanwhile, the risk plan stayed tight.
Enter after a break, place a stop below the last meaningful low, and aim for roughly a 1:2 reward-to-risk.
By the numbers
- SPY: +0.8% on the session
- QQQ: +1.2% on the session
- Gold: testing near $2,942 per ounce
- BTC: traders referenced $95,000 support
Key takeaways for tomorrow’s playbook
- Prefer pullback entries in QQQ-style leaders, rather than chasing green candles late.
- Watch whether SPY holds above its last higher low, because that often signals breadth stability.
- Treat gold near records as a two-way zone, and demand a tidy setup before sizing up.
- Use volume as the lie detector, because weak breakouts fail fast in the final hour.
- Keep stops mechanical, since momentum rewards speed and punishes hesitation.
Risk still sits in the background like a draught through a cracked window. Momentum can pay quickly. It can also reverse quicker, especially into the close when liquidity thins and headlines travel faster than charts.
For more on this topic see our deep-dives on Bitcoin Price and Morgan Stanley ETF Inflows: What Traders Track, Crypto Market Rebound: Expert Bitcoin Forecasts After the Crash, and Bitcoin Price Rallies on ETF Flows: Reading Spot ETF Demand.
For more on this topic see our deep-dives on Stocks to Watch: AAPL, SOFI and the Bank Red Flags Investors Track, Intel Share Price: Inside the Turnaround Rally and Valuation Debate, and FedEx Earnings: Guidance, Cost Pressure and Freight Spin-Off Risk.
What our analysts watch: Three lenses dominate our reading of the equity tape. Sector rotation tells us where capital is moving (defensives versus cyclicals, value versus growth).
Earnings revisions show whether analyst expectations are catching up to or trailing reality. Real yields and the dollar set the discount rate that valuation multiples respond to.
When earnings estimates rise faster than the index price and real yields stabilise, the setup tends to favour patient longs.
Related coverage on Volity
- What Is a P/E Ratio and How to Use It
- Fundamental Analysis in Stock Trading: A Working Definition
- Growth Investing vs Value Investing: Which Style Fits You?
- Fractional Shares Explained: How to Start Investing With
- How to Start Stock Trading: A 2026 Beginner Guide
- Dividend Investing for Beginners: How to Start
Frequently asked questions
How much money do I need to start trading stocks?
Many regulated brokers now allow account opening with no minimum deposit and offer fractional shares for as little as $1. A practical starting balance for a long-only beginner is $500 to $2,000, enough to diversify across a handful of positions without paying meaningful percentage spreads. The FCA publishes investor education resources worth reading before opening an account.
What is the difference between stocks, ETFs, and CFDs?
A stock is direct ownership in a company. An ETF is a basket of stocks (or other assets) traded as a single security. A CFD (contract for difference) is a leveraged derivative that tracks the underlying price without conferring ownership. Each has different cost, tax, and risk profiles. ESMA imposes leverage caps on retail CFDs in the EU and UK.
How do I choose a trustworthy broker?
Verify regulation with a tier-one authority (FCA in the UK, CySEC in Cyprus, BaFin in Germany, ASIC in Australia, or your local regulator). Check segregated client funds, negative-balance protection, transparent fees, and a clean disciplinary record. Avoid any platform offering guaranteed returns or pressuring deposits. The FCA Financial Services Register is free to search.
Should I day-trade or invest long-term?
Most retail accounts that day-trade lose money over time. Long-term passive investing in diversified index ETFs has historically delivered competitive returns with far less effort and lower stress. Active day-trading can work, but it requires capital, an edge proven over hundreds of trades, and the time to monitor positions intraday. Start passive; layer active only after the basics are durable.
Related guides
- Indices trading platforms
- Best AI stocks to invest in
- Gold trading platform
- Bitcoin explained
- Risk management
Alexander Bennett, Volity research: The Volity desk reads the daily risk regime through a three-asset confirmation board. Day one: where is QQQ relative to its prior higher low, and is breadth confirming the move beyond the mega-cap cohort.
Day two: is gold trending in the same direction as long-duration tech, and is the move respecting prior breakout zones rather than chasing first prints near records. Day three: is Bitcoin holding the spot bid while equity volatility prints firm.
When all three confirm, momentum entries pay; when one diverges, the signal degrades; when two diverge, fade-the-breakout is the higher-probability play. Discipline beats conviction during these windows, because liquidity thins fast into the closing hour.
Volity analyst FAQ
Why does QQQ trade differently from SPY on momentum days?
QQQ concentrates exposure in the Nasdaq-100 mega-cap technology and AI cohort, which carries materially higher beta than the broader S&P 500 universe represented by SPY. On momentum days, the same percentage move in mega-cap tech translates into a larger QQQ move and a smaller SPY move, with sector rotation underneath the SPY tape often hidden by the index calm. The Investopedia Nasdaq-100 primer covers the index construction.
How does gold near record highs affect tech equities?
Gold strength near record highs typically signals dollar weakness, easing real yields, or rising geopolitical risk premia. Each channel can support long-duration tech because lower discount rates lift growth-equity valuations.
However, the relationship breaks during stagflation regimes, when gold rises on inflation fears and tech falls on rates pressure. The regime conditioning matters more than the directional headline.
The World Gold Council research hub tracks the underlying drivers.
Is Bitcoin a risk-on indicator for stock traders?
Bitcoin behaves as a high-beta risk-on asset on most trading days, with realised correlation to QQQ rising sharply during macro stress windows. The honest framing is that BTC strength alongside firm tech is a confirmation; BTC weakness during a tech rally is a divergence worth respecting. The CoinDesk Bitcoin price reference aggregates the daily tape against equity benchmarks.
What is a golden cross and does it actually matter?
A golden cross prints when a faster moving average (typically the fifty-day) crosses above a slower one (typically the two-hundred-day). The signal carries weight because it summarises momentum-regime change rather than predicting one. Empirically, golden crosses on QQQ and SPY have preceded extended uptrends often enough to be respected and failed often enough to require confirmation from breadth and volume. The Investopedia golden-cross primer covers the canonical mechanics.
External references
- Investopedia Nasdaq-100 primer
- World Gold Council research hub
- CoinDesk Bitcoin price
Volity operates a trading platform and also publishes educational and analytical content about trading. The content on this page is for educational purposes only and should not be considered financial advice. Volity may benefit commercially when readers open trading accounts through links on this site.
Our content is produced and reviewed under documented editorial standards; comparison and review methodology is published here.
Related reading: complete gold trading guide.