Screeners based on backward-looking metrics can identify “Value Traps” where a low P/E ratio hides deteriorating business models, 68% of 2026 retail screen “hits” identify value traps because quantitative filters miss qualitative red flags buried in regulatory filings. Over-optimization of screener criteria creates “Curve Fitting” risk where past performance becomes meaningless on new market regimes, a 2026 screener built on 2024-2025 data often fails catastrophically when the macro environment shifts. Alternative data integration (news sentiment, NLP) introduces correlation bias where multiple screeners are all reading the same news feeds simultaneously, creating synchronized selling when sentiment turns negative. Past performance is not indicative of future results. Capital at risk.
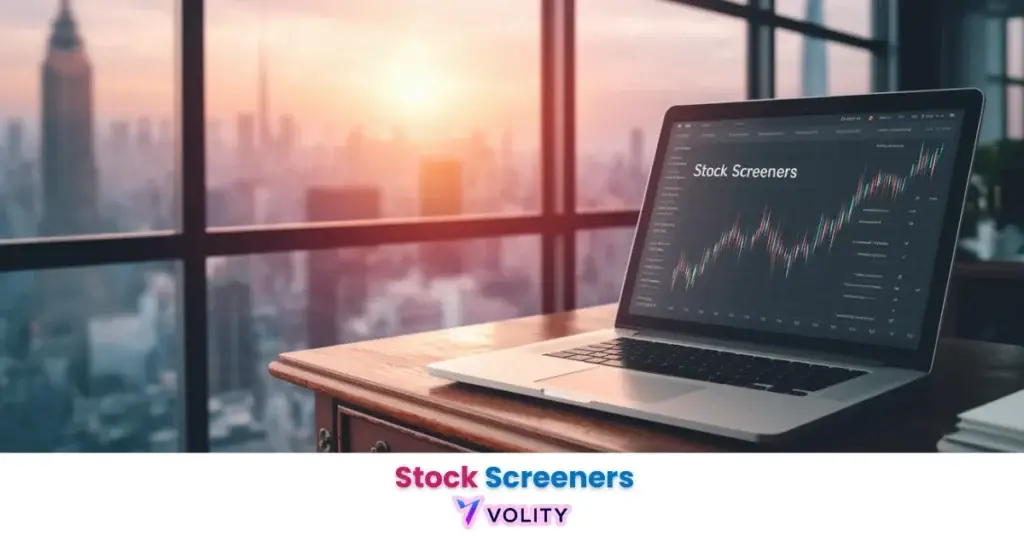
Stock screeners identify high-quality investments by filtering the market against quantitative criteria. Extended-hours scanners apply the same filtering logic to surface after-hours movers the moment earnings or news break. In 2026, the standard screening framework has shifted from “growth-at-any-cost” toward “realized returns,” focusing on AI-monetization and structural margin expansion. By utilizing modern metrics like the 14.7% Net Margin threshold and Revenue Per Employee (RPE) acceleration, investors can distinguish between overhyped “AI-Washers” and legitimate productivity leaders in the modern algorithmic market.
While understanding Stock Screeners is important, applying that knowledge is where the real growth happens. Create Your Free Forex Trading Account to practice with a free demo account and put your strategy to the test.
What is a stock screener and how does it work?
A stock screener is a technical tool that filters a universe of securities based on specific user-defined criteria, identifying the most attractive candidates for deeper qualitative research. This mechanism allows investors to convert 10,000+ available tickers into a manageable shortlist of 5-20 research-worthy candidates. It serves as the mechanical first step for eliminating obvious underperformers and highlighting outliers worthy of deeper analysis.
Stock screeners function through database integration, allowing the tool to aggregate balance sheet, income statement, and technical data simultaneously. Filtering Logic using Boolean AND/OR operators creates complex multi-factor setups where a screener requires (Net Margin > 14.7% AND RPE Growth > 2x Industry) to identify legitimate productivity leaders. The Screening Engine delivers real-time results from thousands of global tickers, executing thousands of mathematical comparisons in microseconds.
Over 85% of institutional funds have integrated “Alternative Data” (NLP news and sentiment) into their primary screening workflows, identifying a shift toward behavioral signals that precede financial statement updates (Nasdaq Market Insights, 2026). This evolution reflects the reality that 2026 markets move faster than quarterly earnings releases, requiring screeners to incorporate forward-looking sentiment velocity and social media momentum indicators.
The Shift to “Realized Returns” Screening
The Realized Returns regime identifies a 2026 pivot where investors filter for actual profit margin expansion rather than just “AI potential” hype. This transition from model-growth to monetization-growth reveals that the companies generating the most shareholder value are not the ones with the highest revenue projections, but those demonstrating disciplined cost management and pricing power. Usage-Based Pricing models, where companies charge per task or result rather than flat subscriptions, are now the leading indicator of sustainable 2026 profitability, as they inherently align company incentives with customer success.
Ready to Elevate Your Trading?
You have the information. Now, get the platform. Join thousands of successful traders who use Volity for its powerful tools, fast execution, and dedicated support.
Create Your Account in Under 3 MinutesFundamental Filters: Screening for AI Monetization in 2026
AI-performance screening identifies the specific financial metrics, such as the 14.7% net margin threshold, that reveal which companies are successfully converting AI technology into profit. The S&P 500 average net profit margin reached a historic record of 14.7% in Q1 2026, driven by widespread AI-led labor displacement (Penn Mutual AM Report, 2026). Companies exceeding this threshold demonstrate that their operational efficiency translates to actual shareholder value, not just impressive top-line revenue growth.
AI Gross Margin (50%) identifies why 2026 AI-native margins are lower than traditional SaaS despite pricing power, large language models carry substantial computational costs of API calls, cloud infrastructure, and token generation expenditures, reducing gross margins to 50-70%. Revenue Per Employee (RPE) Acceleration reveals the primary lead indicator for companies effectively displacing labor with AI. A company growing revenue 2x faster than headcount demonstrates that automation is yielding tangible productivity gains, not just PR spin. Screeners filtering for RPE growth > 2x industry average identify the companies that have actually implemented working AI systems, not merely announced them.
Fundamental Analysis reveals how to audit these metrics from quarterly earnings reports and SEC filings, ensuring the numbers represent real productivity gains rather than accounting adjustments.
Advanced Technical and Sentiment Screening
Multi-factor screening identifies high-conviction trades by ensuring that strong fundamental value is supported by positive market momentum and sentiment volume. This section covers RSI < 30 (oversold) and Price > 200-day SMA (structural uptrend), combining valuation support with momentum confirmation. Sentiment NLP screens for tickers with a 300% surge in “Positive” social mentions, identifying retail enthusiasm that often precedes institutional adoption. Volatility Compression filters for low-ATR stocks nearing a historical breakout point, anticipating the moment when range expansion occurs.
A trader utilized a 2026 screener to find a stock with a Net Margin > 15% and an RSI pullback to 35 in March, identifying Salesforce (CRM) as an “Application Layer” leader. The screener correctly flagged CRM’s undervalued AI-Agentforce monetization strategy; the stock surged 14% in April as institutional allocators recognized the opportunity. Past performance is not indicative of future results.
2026 Stock Screener Benchmarks and Top Picks
Screener performance benchmarks identify the most effective criteria for surface-winning stocks in the current high-rotation 2026 market.
| Category | 2026 Filter Target | Top Pick (Example) | Key Metric to Watch |
| Infrastructure | Blackwell Ramp | NVIDIA (NVDA) | 90% Chip Share |
| Hyperscalers | Azure Growth (40%) | Microsoft (MSFT) | Gemini Integration |
| Vertical AI | Precise Gains | AppLovin (APP) | Ad-Targeting ROAS |
| Application | Agent Monetization | Salesforce (CRM) | Firefly Adoption |
| Energy/Infra | Grid Upgrades | Siemens Energy | Copper Deficit |
Common Mistakes and Limitations of Automated Screens
Data reliance bias indicates that investors often ignore qualitative factors like management quality when relying exclusively on automated stock screens. “AI-Washing” Risk represents how companies can manipulate margin data to look like “AI Leaders” without real automation. The Crowding Effect explains why the most obvious “Screener Hits” often face high volatility and low risk-to-reward ratios because every retail trader is running the same filter. Backtesting Trap reveals why historical success (2024-2025) may not apply to the 2026 “Tightening” regime when macro conditions shift fundamentally.
A stock screener finds “Candidates,” not “Winners”; in 2026, 68% of retail screen hits are identified as value traps because they satisfy quantitative filters while hiding structural liabilities in their regulatory filings. Price-Earnings Ratio analysis helps identify red flags that automated screeners miss.
Turn Knowledge into Profit
You have done the reading, now it is time to act. The best way to learn is by doing. Open a free, no-risk demo account and practice your strategy with virtual funds today.
Open a Free Demo AccountStep-by-Step: How to Build Your 2026 Master Screen
Structured screening represents the most effective method for maintaining discipline and consistency in high-growth stock selection. Begin by defining your goal: are you seeking undervalued “Deep Value” stocks or explosive growth candidates? Set the “Baseline” with Net Margin > 14.7% and P/E < 25x, establishing a quality floor. Apply the "AI Modifier" by requiring RPE Growth > 2x Industry, identifying companies where automation is yielding real productivity gains. Add Technical Confirmation with Price above 50-day SMA, ensuring the candidate is not fighting a broken technical structure.
How to Choose Stocks techniques enable you to evaluate individual names once your screener narrows the list to 5-15 candidates. Portfolio Rebalancing discipline ensures that your screened positions don’t become over-weighted as winners appreciate significantly more than losers.
Key Takeaways
- [Stock screeners] are essential tools that filter the market universe into a manageable shortlist of data-driven investment candidates.
- [AI performance metrics] have replaced simple hype in 2026, with investors now screening for actual net margin and RPE expansion.
- [The 14.7% net margin] threshold is the current S&P 500 benchmark for identifying companies with superior operational efficiency.
- [Revenue Per Employee] (RPE) acceleration is a primary lead indicator for identifying companies that are effectively displacing labor with AI.
- [Multi-factor screens] provide the highest win rates by ensuring that fundamental value is supported by technical momentum and sentiment.
- [Qualitative research] remains mandatory even after a screen, as automated tools cannot fully assess management quality or structural risk.
Frequently Asked Questions
This article contains references to Stock Screeners and Volity, a regulated CFD trading platform. This content is produced for educational purposes only and does not constitute financial advice or a recommendation to buy or sell any financial instrument. Always verify current regulatory status and platform details before using any trading service. Some links in this article may be affiliate links.