You found a stock you like, the price looks fair, and then someone asks the question that stops you cold: what is a P/E ratio, and is this one too high? A P/E ratio is the price you pay for one unit of a company’s yearly profit. Read it in a minute, calculate it in seconds, and you stop guessing whether a share is expensive or cheap.
TL;DR / Quick insight: P/E ratio = share price divided by earnings per share (EPS); it shows how many years of current profit you are paying for. A high P/E often means the market expects growth (or is overpaying); a low P/E can mean a bargain (or a broken business). Always judge a P/E against the same industry and the company’s own history, never a magic number, and pair it with at least two other checks before you decide.
P/E (short for price-to-earnings) is the most-quoted number in stock investing because it puts two companies on the same scale. A 5 share and a 500 share tell you nothing on their own. But “I am paying 18 for every 1 of yearly profit” versus “60 for every 1” is a comparison anyone can grasp.
Read a P/E ratio in one plain sentence
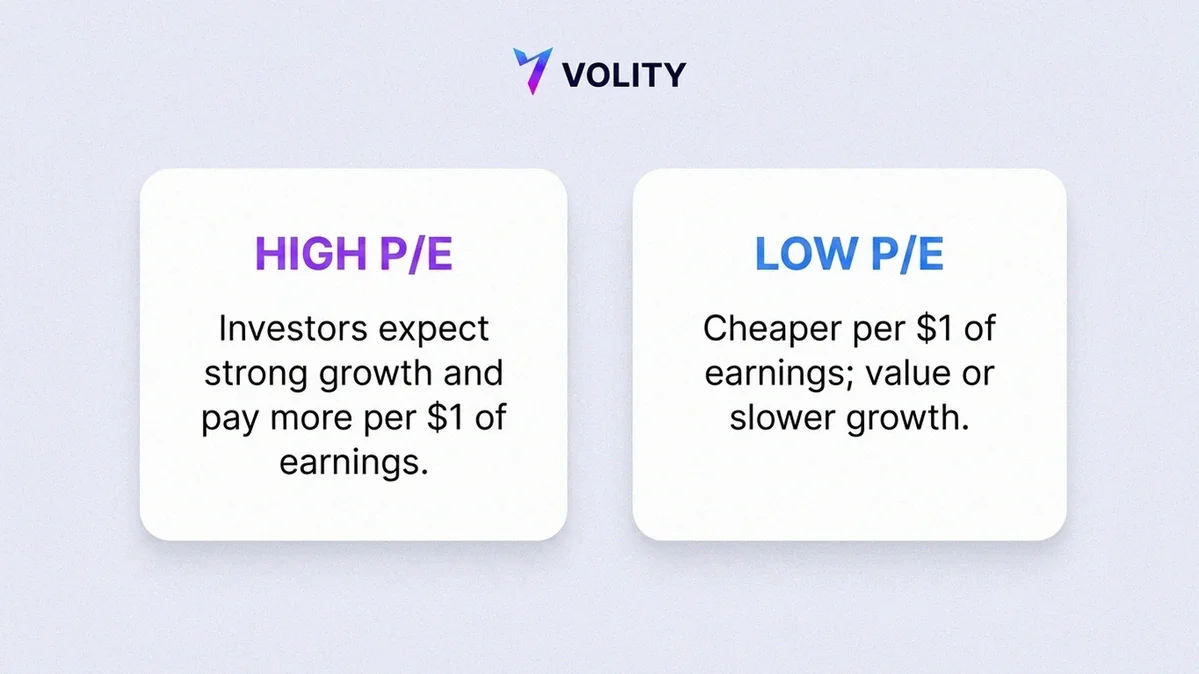
“Earnings” means profit. A stock with a P/E of 20 costs you 20 to buy a claim on 1 of yearly profit; at today’s profit level it would take roughly 20 years of earnings to earn back the price. Read a P/E like a price tag, not a grade handed down by experts. A higher number means the market pays more for each 1 of profit, usually because it expects growth. A lower number means it pays less, because the business is cheap or in trouble.
So restate any P/E as “I am paying about X for every 1 of yearly profit.” Don’t call it good or bad before you know what it sits against.
Calculate a P/E yourself with a worked example
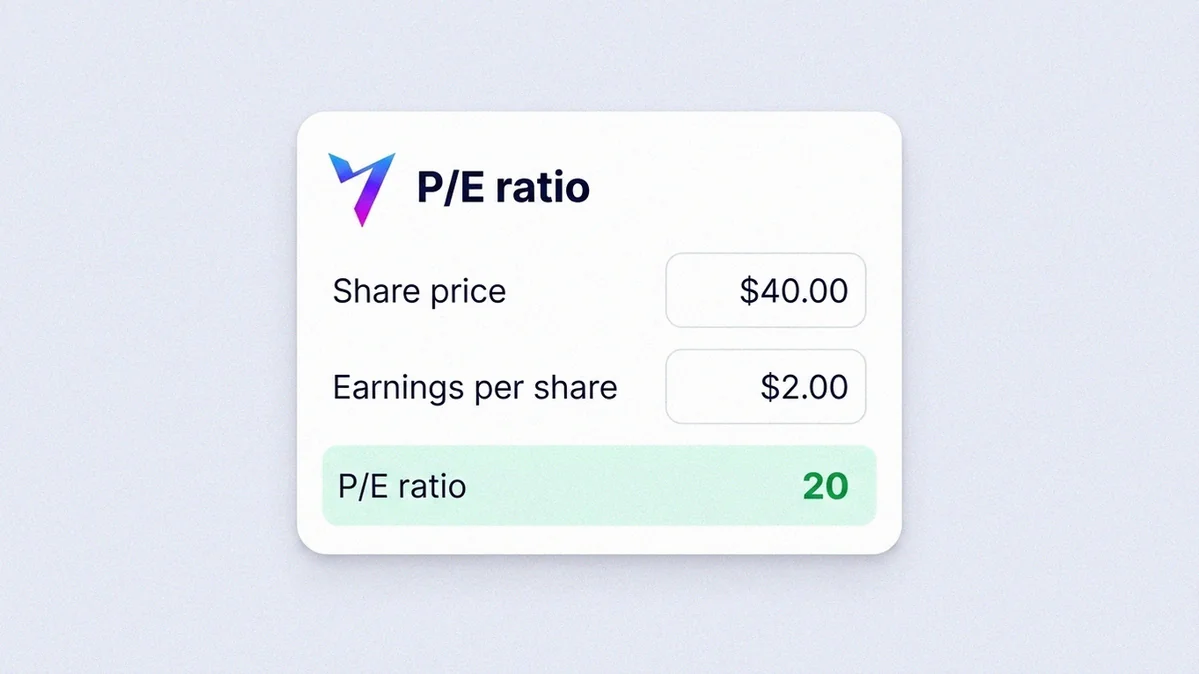
The formula has two inputs, both published for every listed company:
P/E ratio = Share price ÷ Earnings per share (EPS)
EPS (earnings per share) is the company’s total yearly profit divided by the number of shares. Slice the year’s profit into one piece per share, and EPS is one slice. Most stock screens show it. Here is an illustrative example with made-up numbers:
- Find the share price. Suppose it trades at an illustrative 100.
- Find the EPS. Suppose it earned an illustrative 5 per share last year.
- Divide. 100 ÷ 5 = 20. The P/E is 20.
- Translate it. You pay 20 for every 1 of yearly profit.
- Sanity-check it. Is 20 high or low for this business?
A second route gives the same answer: divide market capitalisation (price times all shares) by total yearly profit.
Calculate one P/E by hand, then reproduce it for a real share on your Volity stocks screen. Don’t trust a number you cannot explain.
Judge a high P/E versus a low P/E correctly
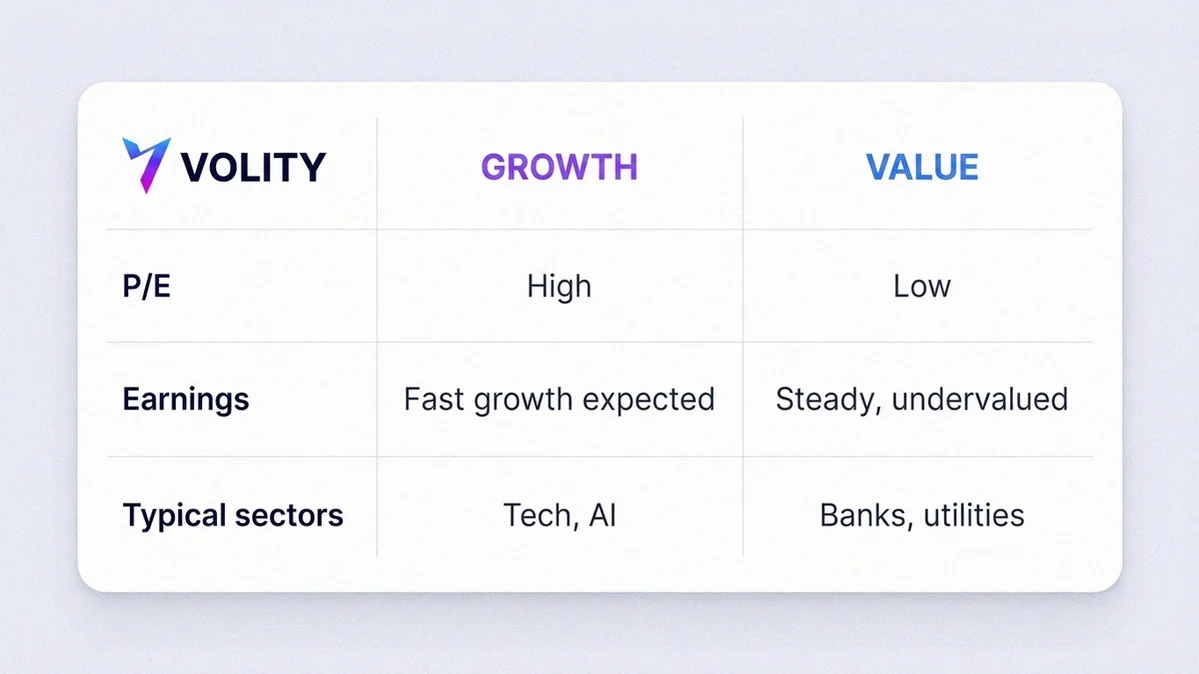
This is where beginners trip. The instinct says “low P/E equals buy, high equals avoid.” Reality is messier. A high P/E usually means the market expects fast growth or is overpaying. A low P/E means a bargain the crowd overlooked, or a warning that earnings will fall. The number alone cannot tell you which.
| What you see | The hopeful reading | The warning reading |
|---|---|---|
| High P/E | Market expects strong future growth | The stock is overpriced and could fall |
| Low P/E | An overlooked bargain at a fair price | A value trap – cheap because the business is failing |
| Negative P/E | (none) | The company is losing money; P/E is meaningless |
A P/E only has meaning relative to the same industry and the company’s own past. A fast-growing software firm and a slow utility carry very different levels.
Before calling a P/E high or low, set it next to the same-industry level and the company’s recent history. Don’t reach for a magic threshold like “under 15 is cheap.” That rule fools more investors than it helps.
Choose trailing or forward P/E for your question
You will meet two flavours of P/E, and mixing them up wrecks comparisons. Trailing P/E uses real earnings from the last 12 months (TTM, “trailing twelve months”), so it counts as a hard fact: the profit already happened. Forward P/E uses analysts’ estimates for the next 12 months, so it is a forecast that can miss.
Pick trailing for facts about today, forward for the growth bet. Never compare one stock’s trailing P/E with another’s forward P/E, because a fact against a forecast misleads you.
Use P/E without being fooled by it
Not getting fooled is the whole skill. A few traps catch beginners. Negative earnings come first: a money-losing company has a meaningless P/E, not a “very cheap” one. Then the one-off spike, where profit jumped once (a building sold, a lawsuit won) and will not repeat, so the low P/E becomes an illusion. Cross-industry comparison trips others up, because banks, software firms and supermarkets sit at different natural levels. And the value trap catches the rest: a P/E that reads low for a reason, with shrinking sales already priced in. Cheap is not good value.
Run this quick filter on any P/E before you trust it:
- Are earnings positive and normal? No losses, no one-off spike.
- Am I comparing like-for-like? Same industry, same flavour (trailing vs trailing).
- Is the low number cheap or broken? A bargain, or a falling firm.
Trust a P/E only after it survives all three questions. Don’t act on a single tempting number before then.
Pair P/E with simple companion checks
P/E is a starting line, not a verdict. A few easy companions, all on a normal stock screen, turn it into a real picture:
- The PEG ratio takes the P/E divided by the growth rate. It asks whether fast growth justifies a high P/E.
- The company’s own P/E history shows whether today’s number sits unusually high or low versus recent years. That often tells you more than a benchmark.
- Peers in the same sector give you a line-up. Set the stock against three or four rivals, and an odd one out is worth investigating.
- Debt and the revenue trend round it off. Heavy debt or falling sales can mean hollow earnings under a tidy P/E.
The Volity trader education hub covers these signals in plain English.
Add at least two companion checks before acting. Don’t let a single ratio carry the decision.
Run this 10-point checklist before you act
Run this on any real share before you trade. If a line fails, slow down.
- Do I know whether this is a trailing or forward P/E?
- Am I comparing it only against the same industry?
- Are the company’s earnings positive, so the P/E is meaningful?
- How does it sit against the company’s own P/E history?
- Have I growth-adjusted it with a glance at PEG?
- Is last year’s profit normal, not a one-off spike?
- If the P/E is low, is it a bargain or a value trap?
- Have I checked the company’s debt and revenue trend?
- Am I comparing like with like (trailing vs trailing) across stocks?
- Have I avoided anchoring on a single magic number for “good”?
Run the full checklist before a trade. Don’t skip the lines on debt and one-off earnings, because that is where costly surprises hide.
Put the skill to work in one account
Reading a P/E only helps if you can act on it. On Volity you look up any listed share’s P/E, compare it to its peers, and buy it in full or as a fractional share (a slice of one share, so a 1,000 stock is reachable with a small stake). Real shares, crypto and CFDs sit in one login, and trading on the Markets account is commission-free. A free demo account on every tier lets you rehearse the loop with virtual money first. The toolkit lives on the Volity stocks hub, and the published fees and account types show what each tier costs.
OPEN A VOLITY ACCOUNT, start on a FREE DEMO ACCOUNT, run your checklist on one real share, then trade live. Don’t let a tidy P/E rush you in before the companion check.
Reviewed by: A. Bennett, Volity editorial desk.
Data integrity: the P/E formula and the trailing-versus-forward and companion-metric guidance are standard investing education; all worked figures are illustrative teaching examples, not real market or company data. Volity product facts are verified against the published Volity fee schedule and account documentation as of June 2026.
Related Volity guides
Related coverage on Volity
- Fundamental Analysis in Stock Trading: A Working Definition
- Growth Investing vs Value Investing: Which Style Fits You?
- How to Start Stock Trading: A 2026 Beginner Guide
- Dividend Investing for Beginners: How to Start
- Dollar-Cost Averaging Explained: A Beginner Guide
Frequently asked questions
What is a good P/E ratio?
There is no single good number. Judge a P/E against its industry’s typical level, the company’s own history, and its growth rate; a P/E of 30 can be reasonable for a fast grower and expensive for a slow one.
How do you calculate a P/E ratio?
Divide the share price by the earnings per share (EPS). A share priced at an illustrative 100 with EPS of 5 has a P/E of 20. EPS is published on every stock screen, so you just divide one reported number by another.
Is a high P/E bad?
Not automatically. It often means the market expects strong growth, which can be justified; it can also mean the stock is overpriced. Check the growth rate, the peers, and the company’s history before deciding.
What does a negative P/E mean?
It means the company has negative earnings – it is losing money – so the ratio is meaningless, not “very cheap.” For loss-making companies, lean on revenue growth, cash position and debt instead.
What is the difference between trailing and forward P/E?
Trailing P/E uses real earnings already reported over the last 12 months, so it is a fact. Forward P/E uses estimates for the next 12 months, so it is a forecast. Never compare one stock’s trailing figure with another’s forward figure.
Can I find a stock’s P/E on Volity and trade it?
Yes. Look up any listed share’s P/E on the Volity stocks screen, compare it against peers, and buy it as a full or fractional share, commission-free on the Markets account. Try it on a free demo account first.
Sources
The guidance above draws on the following public sources.
- Corporate Finance Institute – the P/E ratio formula explained
- Corporate Finance Institute – pair ratios with fundamental checks
- arXiv (A growth adjusted price-earnings ratio) – growth-adjusting the P/E
- arXiv (Panel Data Nowcasting: The Case of Price-Earnings Ratios) – research on price-earnings ratios
- Nasdaq – look up a live P/E
- Nasdaq – where earnings per share come from
- Investor.gov – how shares and earnings work
- Investor.gov – how share prices are set
- Euronext – listed company data page
- European Central Bank – when valuations look stretched