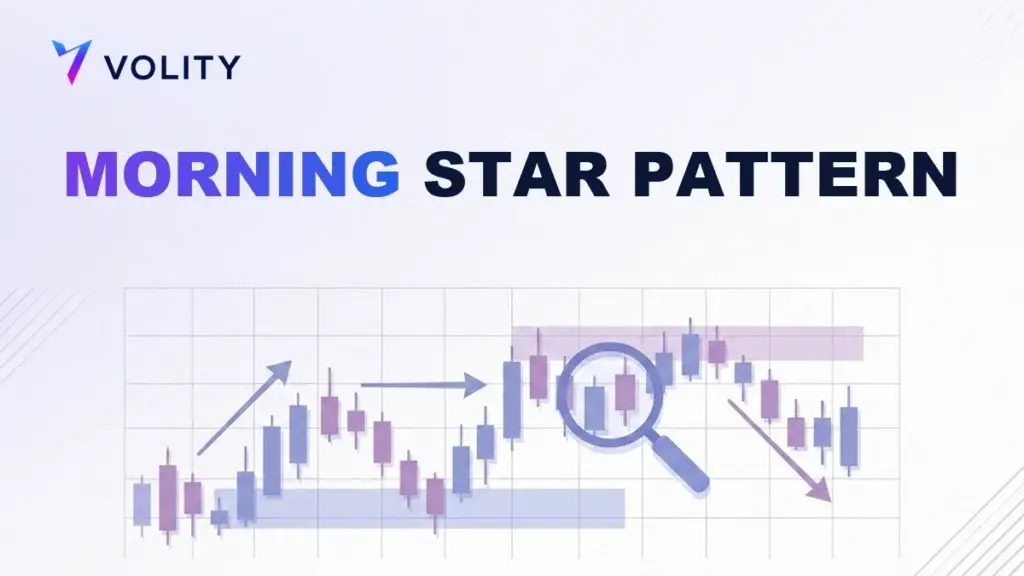
The morning star pattern is a three-candle bullish reversal that forms at the bottom of a downtrend. A long bearish candle comes first, then a small indecision candle, and finally a long bullish candle that pushes back into the first. Plenty of traders type it into a chart search as the morningstar pattern, written as one word, and it means the same thing either way: selling pressure has run out of steam and buyers are stepping in.
What is the morning star pattern?
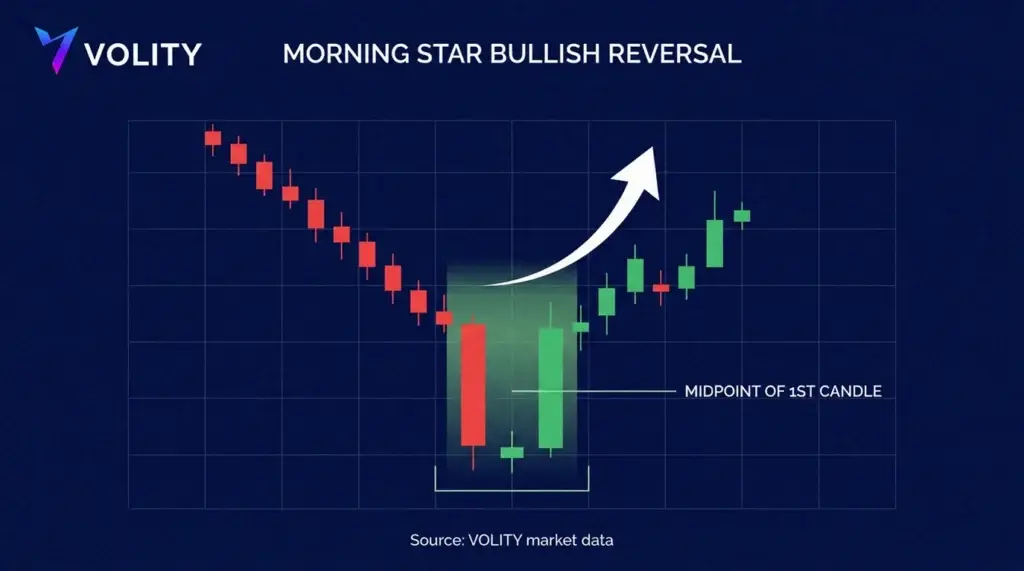
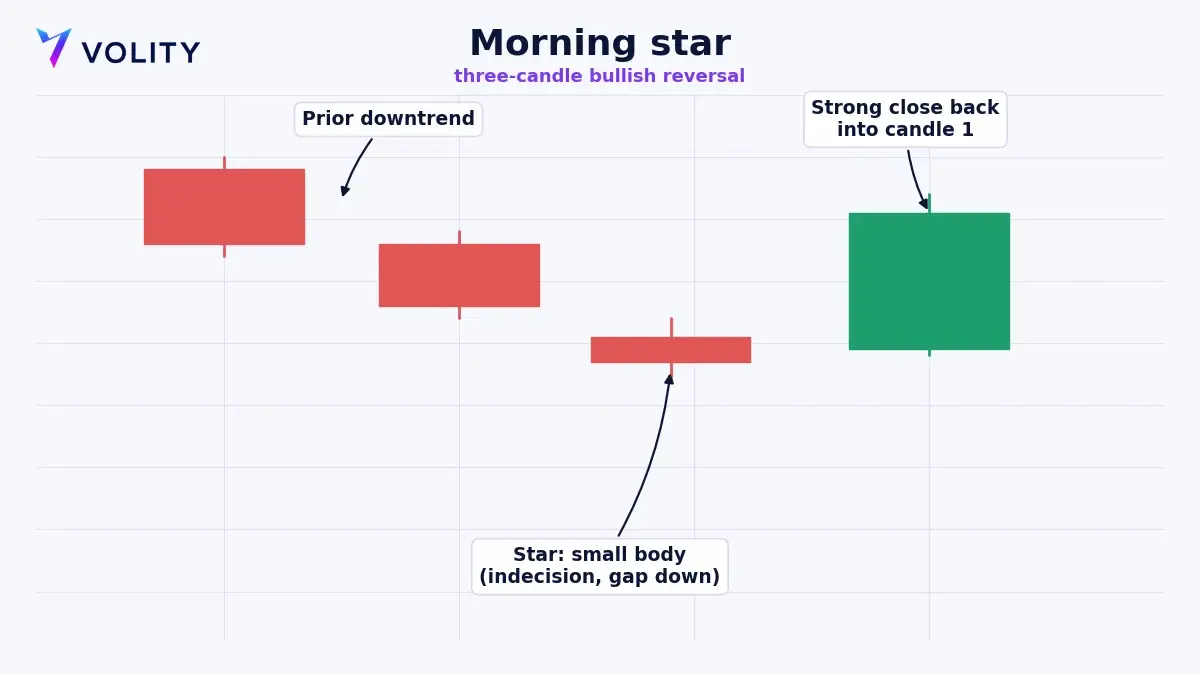
The morning star is a bottoming pattern built from three consecutive candles, and each one carries part of the story of a trend turning from down to up. It is one of the classic candlestick reversal signals, read the same way whether you are looking at forex, an index, a commodity or crypto.
- A long bearish candle extends the existing downtrend, with sellers firmly in control.
- A small-bodied star gaps or opens lower and shows hesitation. It can close up or down, and when that middle candle prints as a doji the formation becomes a morning doji star, a slightly stronger variant.
- A long bullish candle closes well into the body of the first, ideally above its midpoint, which confirms that buyers have taken control.
The deeper the third candle closes into the first, the stronger the signal. A close that erases most of the opening decline is far more convincing than one that only nibbles at it. For a bar-by-bar walkthrough of how the shape forms in real time, our morning star candlestick guide takes it apart step by step.
Is the morningstar pattern the same as the morning star?
Yes. The morningstar pattern, written as one word, and the morning star pattern, written as two, describe the same three-candle formation. The single-word spelling is simply how many people type the search. There is one pattern, and it is the bullish reversal described here.
It also helps to clear up a separate mix-up. This candlestick formation has nothing to do with any investment-research or fund-rating company that happens to share a similar name. When traders point to a morning star on a price chart, they mean the reversal candles on the chart, and it has nothing to do with a company or its star ratings. Keep the two apart and the searches stop competing in your head.
What does the morning star signal?
The pattern maps a shift in the balance of power across three sessions. The first candle shows sellers still on top. The middle star shows that push stalling as neither side gets far, which is the earliest hint that selling is drying up. The third candle shows buyers arriving in force and taking back ground. That hesitation in the middle is the hinge the whole trend turns on.
Because the signal is built from three candles instead of one, it tends to be more dependable than single-bar reversals such as the hammer. The formation carries its own confirmation in the third candle. The best morning stars still show up at a support level, a prior swing low or a round number, backed by rising volume on that third bar.
How do you trade the morning star pattern?
A structured routine keeps risk defined and takes the guesswork out.
- Confirm the context first. You want a clear prior downtrend and, ideally, a support zone where the pattern completes.
- Check the third candle. It should be a strong bullish bar closing well into the body of the first. A weak third candle is not a valid morning star.
- Enter on the close of the third candle, or wait for the next candle to trade above the pattern’s high if you want extra confirmation.
- Place a protective stop below the low of the star in the middle. A move back under that low invalidates the reversal.
- Aim for the next resistance level or a fixed reward-to-risk multiple, and trail the stop as the move develops.
A morning star that lines up with an oversold momentum reading or a bullish divergence is stronger than one standing on its own. Confluence, where several signals point the same way, is what separates a high-probability setup from a hopeful one.
Morning star vs evening star: what is the difference?
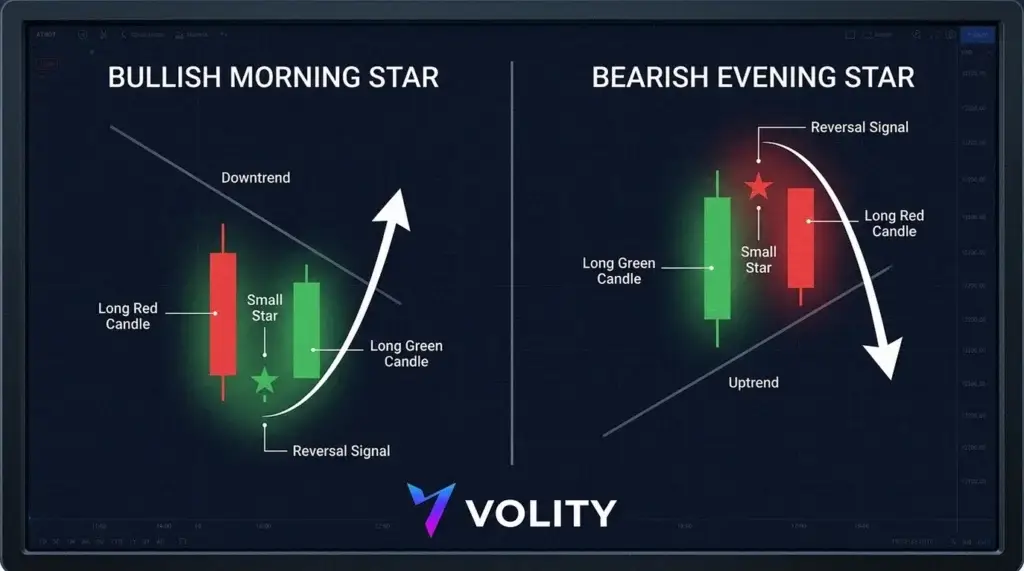
The evening star pattern is the exact bearish mirror of the morning star. Same three-candle structure, opposite direction and opposite location. This table lays them side by side.
| Feature | Morning star | Evening star |
| Appears at | Bottom of a downtrend | Top of an uptrend |
| Signal | Bullish reversal | Bearish reversal |
| Candle one | Long bearish | Long bullish |
| Candle two | Small star (indecision) | Small star (indecision) |
| Candle three | Long bullish into candle one | Long bearish into candle one |
Learn one and you have learned both. Read a morning star as buyers overpowering exhausted sellers at a bottom, and the evening star is simply sellers overpowering exhausted buyers at a top. If you trade the bearish side too, our guide to the evening star and the wider set of reversal candlestick patterns go deeper.
What are the limitations of the morning star?
No pattern is a guarantee. A morning star can form and still fail when strong resistance sits just overhead or when the broader trend is firmly bearish. In thin or very volatile markets the gaps and bodies can mislead you. And because it takes three candles to complete, part of the move is already spent by the time the pattern confirms, which can worsen your entry.
Treat it as one strong piece of evidence and pair it with the rest of your process. Combine it with clear support and resistance, confirm that momentum and volume back the turn, and size every trade from the stop. On leveraged products such as CFDs a failed reversal can move against you quickly, so a stop below the star’s low and a fixed risk per trade keep any single failure small. As with any tool in technical analysis, the edge comes from repetition and discipline more than from any single signal.
How can you trade morning star setups on Volity?
Volity is an all-in-one money hub that keeps your wallet, payments and trading in a single account. The charting in Volity MT lets you mark support, spot the morning star across more than 40 forex pairs, global indices, commodities and crypto, and attach a stop-loss and take-profit the moment the third candle confirms, so your risk is set from the first click.
Reversal patterns reward traders who can act in both directions, which is where CFD trading fits, letting you take the morning star long and the evening star short. Leverage reaches up to 1:500 on selected forex pairs, 1:100 on commodities and 1:50 on crypto, with margin shown before every order and negative balance protection in place. Execution is regulated by CySEC under UBK Markets, licence 186/12. The full cost picture sits in the published charges and fees, and the leverage caps follow the product rules set by ESMA for retail CFDs.
Related patterns
Frequently asked questions
Is the morning star pattern bullish or bearish?
The morning star pattern is bullish. It forms at the bottom of a downtrend and signals a reversal to the upside, as buyers overpower exhausted sellers across three candles. Its bearish mirror image, which appears at the top of an uptrend, is the evening star pattern.
How reliable is the morningstar pattern?
The morningstar pattern is one of the more reliable candlestick reversals because it carries built-in confirmation in its third candle. Reliability improves when it forms at a support level, includes a doji star and is backed by higher volume. As with any pattern, confirmation and a defined stop still matter before you commit.
What is a morning doji star?
A morning doji star is a morning star whose middle candle is a doji, a candle that opens and closes at nearly the same price. The doji shows complete indecision after the downtrend, which makes the bullish reversal that follows slightly stronger than a standard morning star with a small-bodied middle candle.
No. The morning star, or morningstar, candlestick pattern is a chart formation used in technical analysis. It is unrelated to any investment-research or fund-rating company that shares a similar name. On a price chart the term always refers to the three-candle bullish reversal.